
Anyone who has seriously invested in financial markets starts by learning to separate fluctuations from the trend. If you don’t, your life in the markets will be nasty, brutish and short. The same applies to any analysis of global temperature. You have a trend, principally driven by greenhouse gas concentrations in the atmosphere; and you have fluctuations, principally driven by the El Nino Southern Oscillation (ENSO) cycle.
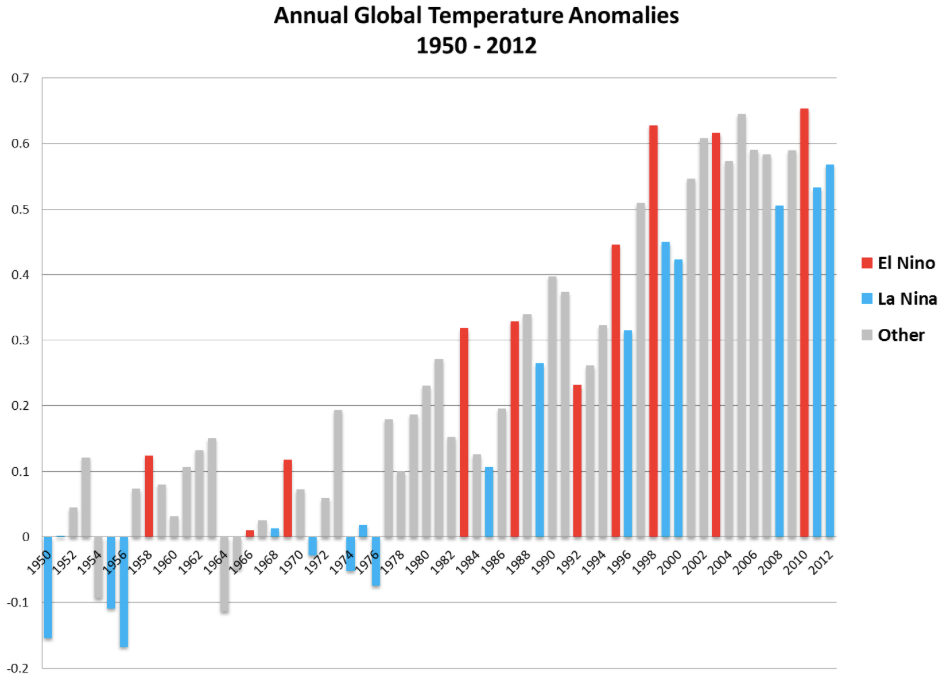
When we are in the El Niño phase, Pacific ocean temperatures are higher then average; in a La Niña phase, lower. The impact is significant enough to influence overall global mean temperature. Accordingly, if you wish to make a statement about the recent trend in global warming, start by adjusting for the ENSO fluctuation. Of course, many don’t. Indeed, the claim that global warming has ceased over the last decade is frequently aired in many a newspaper column (like this from the Wall Street Journal), not just the wackier end of the blogosphere.
Let us for a minute look at the distribution of El Niño and La Niña events over the last couple of decades. The excellent blog Skeptical Science does just that (here) and presents the following chart (click for larger image):
The piece concludes with the following: Continue reading

