Category Archives: Energy revolution

Seba’s Solar Revolution Part 5 (A Blended Solution to Intermittency)

In my last post looking at the potential for solar energy, I highlighted the drawbacks identified by Euan Mearns and Roger Andrews in their blog Energy Matters. They emphasise the disjoint between when and where renewable energy can be produced and when and where it is needed. The disconnect between production and consumption makes any consideration of levelized cost of energy (LCOE) problematic.

LCOE is the cost to produce energy at a particular place and time; it is not the cost to deliver energy to the consumer at a particular place and time. Accordingly, while renewables have made great strides to match or even undercut their fossil-fuel rivals in terms of cost competitiveness on an LCOE basis (see the chart below) this isn’t enough to allow renewables to rule the world.

Untitled 2

Critically, renewables suffer from a feast or famine: throughout the day and over the year, you could be producing too much renewable energy that goes well beyond demand or not enough energy to meet demand. Once you crank up renewables on a much larger extent than now, you get into a world of energy deficits and energy surpluses as shown in the Energy Matters chart below (from here):

Untitled

Nonetheless, when putting together the chart above, Andrews skips around or simply ignores any counter arguments that could upset his thesis.

Critically, the question of renewable energy intermittency is well-known, but is being tackled by grid operators in a holistic, multi-dimensional manner. There is no silver bullet ready to solve the problem of intermittency; that is, the problem of moving energy through time and space.

Nonetheless, if you are a renewable energy skeptic, you can extract any one solution to the problem of intermittency, deconstruct it and then destroy it. In isolation, this is relatively easy to do, and is a classic straw-man argument. You pick any one solution, crank it up to try to solve the intermittency problem in its entirety, and then rubbish the solution due to the astronomic cost estimate that you produce.

Untitled 2

But the solution to the problem of intermittency comes as a package. A range of solutions to the intermittency problem will be rolled out, and no one solution is expected to tackle the problem of intermittency alone. Restated, if each approach is resolving a bite-sized portion of the problem, it only has to be scaled to a far lower size. The range of such solutions could each have a manageable cost, and after being blended together you get to where you want to go: a renewable energy world. Note, I am not saying this is the likely outcome, I am saying that this is a possible outcome.

Untitled

Furthermore, Tony Seba’s predictions are, obviously, forward-looking. So any analysis must be looking at costs out into the future. And those are not just the costs associated with the generation of renewable energy itself, but also the costs to provide a solution to the intermittency problem going out 10 years or more. As of today, if we add the cost of the package of intermittency solutions, 100% energy generation via renewables comes out a lot more expensive than fossil-fuel energy generation  (of course ignoring the cost of climate change). But that says nothing about tomorrow.

What are the partial solutions to the intermittency problem? I would place them into four major categories.

  • Overbuild low cost renewables to partially plug the energy deficits
  • Move renewable energy through space (transmission)
  • Move renewable energy through time (storage)
  • Alter the timing of demand to meet supply

These are the topics for my next posts.

P..S. While checking the link to Energy Matters on this post, I was sad to see that Roger Andrews has just passed away. While I don’t agree with everything he wrote, his posts  have frequently challenged my beliefs and made me delve a lot deeper into the energy literature. Commiserations to his family; he will be missed by the many who follow the Energy Matters blog.


The Green New Deal and Modern Monetary Theory (MMT)

This post is a bit of diversion from my recent focus on the mobility and energy revolutions currently taking place (the solar posts are “to be continued”). The Democrats new super star Alexandria Ocasio-Cortez has been making waves since becoming the youngest woman to ever serve in the United States Congress. Yesterday Ocasio-Cortez submitted a non-binding resolution in the House of Representatives under the title “Recognising the duty of the Federal Government to create a Green New Deal“. If you haven’t read the actual document (a couple of pages long), I urge you take a look rather than get a second-hand interpretation. You can find the resolution here. And Ocasio-Cortez introducing the policy here:

The resolution is to be accomplished “through a 10-year national mobilization” to execute a series of projects and achieve a range of goals, one of which is “meeting 100 percent of the power demand in the United States through clean, renewable, and zero-emission energy sources”. Well I think Tony Seba would approve of that even if Tony would believe this will happen regardless of the government’s involvement through the magic of technology and market forces.

Criticisms, or course, have come thick and fast, but one of the most major relates to cost: who will pay for the Green New Deal? The frequently asked question (FAQ) sheet attached to the resolution gives this answer:

How will you pay for it?

The same way we paid for the New Deal, the 2008 bank-bailout and extended quantitative easing programs. The same way we paid for World War II and all our current wars. The Federal Reserve can extend credit to power these projects and investments….

The critical component of this response to the question of payment is the statement that “the Federal Reserve can extend credit to power these projects and investments”. And this is where I am heading with this post. Ocasio-Cortez is not only an advocate of a far-reaching environmental policy aimed at tackling climate change, but she is also an adherent to the rather arcane economic theory of Modern Monetary Theory, or MMT.

MMT focuses on the fact that modern monetary systems are based on fiat money. This means monetary systems where nothing backs the issuance of paper money, unlike under previous systems which were backed by gold or some other real substance. Under such so called ‘fiat money’ systems, the government can never go bankrupt since it has the power to print money. That said, while the government may not be able to bankrupt itself through printing money, it is quite capable of bankrupting the private sector through printing so much money that it sets off hyper-inflation: think Wehrmacht Germany, Zimbabwe or Venezuela. Nonetheless, MMT adherents see a world of difference between using debt and money creation in a responsible way to achieve policy goals and in an irresponsible way to support some form of crony capitalism.

Critically, the general public finds it very hard to understand the fact that the government can create money from nothing, but this is just an irrefutable fact.

Accordingly, the government can impact on the real economy through printing paper money in exchange for labour or goods. Under Ocasio-Cortez’s plan, the US government could print money, via the Federal Reserve, to buy wind and solar farms and pay workers to install them. It would use government debt to get to where it wants to go.

In many aspects, MMT is not far away from traditional Keynesian economics, which encourages governments to smooth out business cycles through engaging in pump priming the economy by running fiscal deficits whenever a recession emerges. Followers of MMT, however, believe that the government’s power over money creation should not just be used as a safety net in times of trouble but also in a much more proactive goal-oriented manner to solve current problems.

Under MMT, you needn’t worry about deficits and debt in and of themselves, but only if they result in the adverse outcomes of rising inflation and real interest rates. According to followers of MMT, if you run a big deficit and build up a lot of debt with neither inflation rising nor real interest rates spiking, then you have nothing to worry about. MMT also shifts the policy balance of power away from central banks to politicians.

At this stage, I recommend you sit down and spend a very fruitful 45 minutes of your time watching the following January 2019 lecture by the most famous advocate for MMT Stephanie Kelton. Kelton is that rare thing in an economics professor: a great communicator. Anyone who has got this far down the blog post will be able to understand the lecture — I promise (honest). More important, by the end of the lecture you will realize that government spending is not like household spending. So next time a politician says that a government must learn to live within its means just like a household, you will understand that the politician in question doesn’t know what he or she is talking about.

And, finally, in response to Prime Minister Theresa May’s claim that “there is no magic money tree”, well, actually there is, and in the UK it sits within the Bank of England (BOE). In a wonderful BBC Radio 4 programme called “Shaking the Magic Money Tree“, Michael Robinson descended into the depths of the BOE to see money created out of nothing: so the money tree does exist!

That said, magic can be a force for good or evil. I’m not saying that Ocasio-Cortez has no constraint over what the government can do deficit-wise in terms of executing a Green New Deal. But the judicious use of government’s deficits to finance ambitious government goals should not be dismissed out of hand. Financing such goals through deficits has been done before, and, handled well, it can be done again.

Continue reading

Seba’s Solar Revolution Part 4 (A Question of Where and When)

Over the last decade, the efficiency of solar panels has gone up and cost has come down. Accordingly, if we could move solar-generated electricity seamlessly through time and space, even a relatively poorly endowed country like the UK (in terms of solar irradiation and land availability) could meet its energy needs through allocating around 5% of its land mass to solar panels (as I discussed in my last post).

If the world were run by some kind of benevolent green dictator, he or she could possibly just issue a decree mandating a mass solar power build out which would replace all existing fossil fuel plants. In reality, the only dictatorship we face is that of ‘the market’. For solar to spread, therefore, the market must recognise solar as cheaper than existing fossil fuel alternatives.

Moreover, in order to reach a Tony Seba style 100% solar nirvana, solar must transition through a two-stage process. First, it needs to take out all the fossil-fuel competition with respect to new energy generation facilities to be built from now onward. Second, solar must push out all fossil fuel competition in the form of existing energy generation facilities. The first task is much easier than the second.

Energy generation costs are composed of two principal components: 1) the energy generating facility and 2) the ongoing operating and maintenance expenses. The second part is relatively easy to imagine. How much fuel and maintenance is required to produce X amount of energy, say a kilowatt hour (kWh) or megawatt hour (MWh)? For solar, the obvious answer to this question is “not much”. Once you have your panel set up, it just sits there generating electricity when the sun comes up every day. You may occasionally have to clean it and also prevent your local neighbourhood yob writing graffiti all over it or stealing the wires connecting it to the grid, but that’s about all. In economics speak, we describe this situation as one where the marginal cost of generating an additional kWh or MWh of electricity once a panel is in place is close to zero.

The marginal cost when producing 1 kWh or 1 MWh of electricity from a coal or gas-fired facility is, however, not zero since you need to put coal or gas in at one end to get electricity out the other end. For an automobile, you need to stick gasoline in at one end to get motion out the other end (in this case the via engine and the four wheels). Sorry, I know this bit is blindingly obvious.

The more complex bit of the LCOE calculation relates to the capital cost of the energy-generating plant required. For a utility scale solar farm, you will need to secure a large area of land (buy or lease), purchase the requisite number of solar modules, mount them, connect them up and then covert the electricity generated into a grid-compliant standard through the use of inverters and transformers. A 2017 report by the United States National Renewable Energy Laboratory (NREL) shows the cost breakdown of a variety of solar installations by size and also through time in the US.

Untitled 2

Once we know the total cost of the installation, it can then be apportioned over all the electricity generated through the expected lifetime of the facility. Simplistically, the capital cost per unit of energy produced is combined with the operating and maintenance cost of each unit of energy produced to arrive at a single number: the levelled cost of energy (LCOE). The LCOE also takes into account how the project is financed and the time value of money. The NREL provides a more detailed explanation of the LCOE calculation here and also an LCOE calculator that you can play around with here. For those of you who don’t have a financial background and are not familiar with discounted cash flow (DCF) methodology, you can just think of the LCOE as the price at which a project needs to sell its electricity in order to breakeven and stay in business.

Accordingly, if a utility scale solar project has an LCOE of $40 per MWh (which is the same thing as 4 cents per kWh, the financial press switches between the two), then the owners will be very happy bunnies if they can sell their electricity at $50 per MWh. Likewise, an energy consumer may want to enter into a power purchase agreement (PPA) with an energy generator for a set amount of electricity over a set period of time. If a solar utility is offering to enter into the PPA at 4 cents per kWh while a coal-fired facility can only go down to 5 cents per kWh, you will likely go with the solar – other things being equal.

The wording “other things being equal” is critical. Presuming no battery storage is involved, the solar facility can only supply electricity during the day and nothing at night. A factory operating 24/7 needs electricity 24/7. If its weekly requirement is, say, 100 MWh the fact that the solar farm can deliver at $40 per MWh versus $50 for the coal-fired plant will not be a sufficient condition for it to win the contract since it can’t supply the electricity both day AND night. At times, Tony Seba and other commentators can be rather disingenuous in claiming that renewable energy is cheaper than fossil-fuel generated electricity for just this reason. Having an LCOE for renewables lower than that for fossil fuel plants is a necessary but NOT a sufficient condition for renewables to displace fossil fuel. As I stressed in my last post, a kWh or MWh of energy that is not located in time and space is a pretty meaningless concept.

That said, I am not suggesting that we throw LCOE out the window. For renewables to replace fossil fuels, we first need to get the LCOE of renewables below that of fossil fuels and then we need to open up the gap between the two. If solar is generating electricity at $40 per MWh and coal at $100 per MWh, then $60 per MWh is available to transfer the solar generated electricity through time and space. The money could be spent on some form of storage (time) or some form of connection (space). The bigger the gap, the bigger the incentive for markets to try and arbitrage away the cost difference through putting in place mechanisms to transfer energy through such time and space.

With all those caveats in place, it’s time to look at some LCOE numbers. A well-respected benchmark annual appraisal of competing LCOEs is published every November by the investment bank and asset management firm Lazard. The entire slide deck is well worth flipping through and you can find it here, but I will just extract three charts.

First up, you can see that for new build facilities, the LCOE of both wind and utility scale solar is now below that of gas combined cycle and coal. Accordingly, if we didn’t have any issues with respect to the provision of energy in time and space it would be cheaper to deliver all new energy generation through renewables.

Untitled 2

Tony Seba’s claim, however, is that solar will not only be the energy generation vehicle for the future but it will also replace all the old fossil fuel facilities that have been constructed in the past. That is a much tougher hurdle. Remember the LCOE has two principal components: the ongoing operating and maintenance costs and the cost of the facility spread out over all the energy generated over the useful life of that facility.

When looking forward, the cost of building a brand new gas combined cycle or coal facility will be included in the LCOE number, when looking back it won’t. That is because that money has already been spent: it’s a sunk cost. So if solar is to mothball existing fossil fuel power stations, its LCOE must be cheaper that the LCOE of the gas or coal plant made up of the operating and maintenance (O&M) expense alone. The good news from Lazard’s November 2018 report is that wind and solar have got so cheap that they are starting to fulfil that condition as well. The cheapest solar facility at $36 per MWh is cheaper than a large proportion of coal-fired power stations whose operating and O&M costs are between $27 and $45 per MWh.

Untitled

Even more encouraging is the fact that solar has been consistently coming down its cost curve just as Tony Seba predicted.

Untitled

In addition, in areas of high solar irradiance we have seen 20 year power purchase agreements (PPAs) signed with solar utility scale projects at $20 per MWh or lower. The chart below shows the situation in the US, with new PPA price records being set in states like Arizona and Nevada (source: here). Presumably these PPA prices are higher than the projects underlying LCOE otherwise these projects would be loss-making and the solar utilities wouldn’t sign the agreements.

Untitled 2

Fortunately, the cost declines have been such that even in countries with poorer solar irradiance profiles, like those in northern Europe, solar has become increasingly competitive. The chart below is taken from a report by the German Fraunhofer Institute for Solar Energy Systems (ISE). At the time of this post, one US dollar bought 0.87 euros. Keeping that exchange rate in mind, ISE forecasts that the cheapest utility scale solar installations will see their LCOE drop from 4 euros per MWh to 2 euros around 2032. At that price solar will be far cheaper than coal and combined-cycle gas turbine plants.

Untitled

The upshot of this analysis is that countries that are well endowed in terms of solar irradiance already have solar plants that are cheaper than their fossil fuel competition on an LCOE basis, and countries that are less well endowed will see their solar plants winning out over the fossil fuel competitors on an LCOE basis over the next 10 years or so as solar costs continue to decline.

And now for some push back from the renewable energy skeptics Euan Mearns and Roger Andrews from the blog Energy Matters. In November 2018, Spain announced that it intended to move to 100% renewable generated electricity by 2050. Compared with Tony Seba’s claim of 100% solar by 2030 across the entire energy spectrum, it doesn’t seem so aggressive, but let’s put that to one side. In a post in November, Energy Matters took umbrage over the Spanish government’s claim and proceeded to show why such a target would be impossible to achieve.

At the heart of Energy Matters Roger Andrews’ argument is the claim that if we adopted renewables entirely to drive the electricity grid, it would become impossible to transport sufficient energy through time. Solar and wind’s intermittency would lead to large gaps in energy generation, and these gaps would be impossible to fill economically through the use of storage or by any other means. For his analysis, Andrews picked out the average electrical energy consumption and production patterns for two months in Spain: January and July. I will just concentrate on July here, but recommend you read the entire post to follow his argument from beginning to end. Here is the current contribution of renewables production to electricity consumption in July in Spain:

Untitled

And after scaling up renewables production:

Untitled

At this point, it’s worth reproducing the commentary accompanying this chart:

Obviously Spain plans to fill the hole with wind and solar. This approach has one thing going for it – the peaks and troughs in renewables generation are a good match to the demand peaks and troughs. But when we scale up July 2018 wind and solar generation (by a factor of 4.5) to match July 2018 demand we see that the amplitudes don’t cooperate.

Andrews then goes on  to produce a chart showing the deficits and surpluses:

Untitled

Which could only be equated by putting into place 1 terawatt-hours (1 TWh) of storage in his view:

Untitled

In January, the mismatch is even worse with a requirement for 2 TWh of storage to solve the intermittency problem. Roger Andrews further speculated that potentially 5 TWh to 10 TWh may be required to achieve energy security across the entire year. As an aside, how much would a TWh of storage cost? If we are going to provide such storage via batteries, the RNEL in a recent reported issued in January 2019 estimates the cost of a 4-hour system at $380 per kWh.

Untitled

Unfortunately, a terawatt-hour is a billion times bigger than a kilowatt hour. So to provide 1 TWh of battery storage would cost $380 billion at current prices. So to get the amount of storage Andrews suggests, we need trillions of dollars. Given Spain’s gross domestic product was only about $1.3 trillion in 2019, buying trillions of dollars worth of batteries looks unrealistic. Of course, there are other storage options like pumped storage, which Andrews briefly considers, but these have major environmental impacts.

So has Roger Andrews thrust a dagger into Tony Seba’s dream of golden world of solar? Well, these Energy Matters posts are certainly thought-provoking, but if I had a criticism it would be that they suffer from an awful lot of confirmation bias. Andrews appears intent on skewering renewables at the outset and then builds his argument to achieve that end. Accordingly, he frequently makes assumptions in his calculations that look somewhat dubious. In my next post, I will subject Roger Andrews’ skepticism to bit of my own skepticism to see if we can resurrect Tony Seba’s dream .


Seba’s Solar Revolution Part 3 (Where to Put the Panels)

In my last post, I mentioned that the late Cambridge University professor David Mackay was skeptical over the ability of solar to play a lead role in decarbonising the world’s energy infrastructure. MacKay’s highly influential book “Sustainable Energy Without the Hot Air” is rooted in basic science. Yet, despite the text being peppered with scientific identities, it also includes a number of value judgements that touch on the world of economics. And it is from these value judgements that MacKay’s skepticism arises.

MacKay’s book is principally concerned with what it would take to decarbonise the UK economy. Tony Seba, in contrast, forecasts that solar can power the globe not just the UK. In this post, I will stay with the UK, although I will look at other countries in future posts. Nonetheless, for Tony to be right, each and every country must be able to secure its energy needs through solar including the UK (though the solar energy may be imported from abroad). Accordingly, if Mackay’s argument is right (that is that the UK’s solar resource in inadequate) then Tony’s is wrong (notwithstanding the import argument).

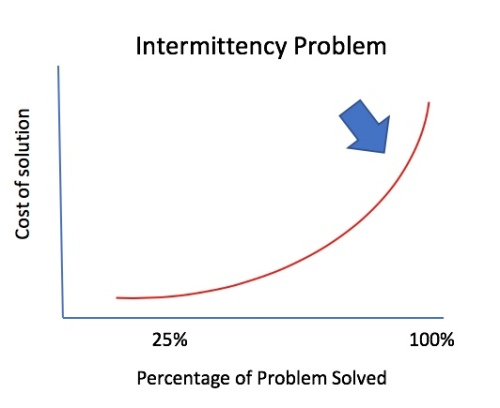
Two of the major pushbacks against solar rest on the land mass requirement for sufficient energy generation and the intermittent nature of solar that puts unbearable stresses on the grid. As a former economist by training, I regard such arguments as second-order ones. They are both really subsumed under cost issues. Land is just a scarce resource like any other, and if the return on the land used for solar is higher than that for any other use, then it should be allocated to solar-power usage (that calculation can take into account the cost of climate change and the public good value of land).

Moreover, the unit of energy we are working with in this post, a kilowatt hour, is quite simplistic in economic terms. Energy is demanded at a particular place and at a particular time (hour of the day, and day of the year). A kilowatt hour generated in mid-summer in Spain in July, it not the same thing as a kilowatt hour consumed in mid-winter in London in January. The levelised cost approach (I will have a lot to say on that in future), which is used to compare different energy-producing assets, doesn’t take time and place into account.

In reality, we can think of the energy market as composed of 8,760 hour-long blocks (24 hours times 365 days) with a GPS attached to each one. In each of these GPS-stamped timed blocks, the market will equalise supply and demand at a certain price.

MacKay’s analysis only implicitly addresses the economics. Nonetheless, before we start moving energy through time and space, we must ensure that we have enough energy to move in the first place. MacKay does tackle that question.

In a section of his book titled “Fantasy time: solar farming”, Mackay conducts a thought experiment within which he covers 5% of the UK land with 10%-efficient solar photovoltaic panels.

untitled

He starts by calculating that “the average raw power of sunshine per square metre of flat ground (in the UK) is roughly 100 W/m2″. However, with a 10% efficiency photovoltaic panel, of the 100 W/m2 only 10 W/m2 is converted into electricity. From my last post we also know that if we leave a 40W light bulb on all day, it will use up nearly 1 kWh of power (0.04kW times 24). So if we generate 10 W per a one metre squared solar panel, we will get a quarter of that in energy, or 0.25 kWh. MacKay in his calculation has allocated 5% of the UK’s land mass to be used for solar power, which gives 200 m2 to each UK citizen. Times 200 by 0.25 kWh and we get 50 kWh per person per day, which compares with total energy demand of 125 kWh per person per day.

Also, as an aside, note that his calculation goes from power (solar irradiance measured in watts or kilowatts) into an energy number (solar insolation measured in watt hours or kilowatt hours).

At this point, let’s take a step back and look at that allocation of 5% of the UK’s land mass to solar panels. The UK land area is 25.25 million hectares and the population 66 million. Divide one by the other and we get around 0.38 hectares per person, (or just under an acre), which is the same thing as 3,800 m2. MacKay gives each person in the UK 4,000 m2 of land each since the population of the UK was about 5 million smaller when he was working out the maths. However, these numbers are near enough.

Switching from metres squared per person to number of persons per square kilometre, which is the standard measure when comparing countries, I have put together a table of population densities for selected countries, mostly ones with large populations, below. Note that a hectare (10,000 m) is 0.01 of a square kilometre, so 0.4 hectares (40,000 mor 0.004 square kilometres) per person translates into 250 people per square kilometre.

untitled


From the table we can see that only the Netherlands, Japan, the Philippines, India and Bangladesh have population densities higher than the UK. So if the UK can become energy self-sufficient via solar it bodes very well for the rest of the world (putting differing solar irradiance numbers for each country aside for the time being). Moreover, the really profligate energy users, like the USA and Australia (which get through over twice the energy per person than the UK), have the advantage of having a lot of land.

Back to the UK and MacKay’s fantasy time solar farming:

untitled

That 50 kWh per day per person amounts to 40% of the UK’s energy consumption of 125 kWh per person per day. Accordingly, if we hold our 10% panel efficiency steady, then to meet 100% of UK energy requirements we would need to cover 12.5% of the UK land mass with solar panels (about 500 m2 per person).

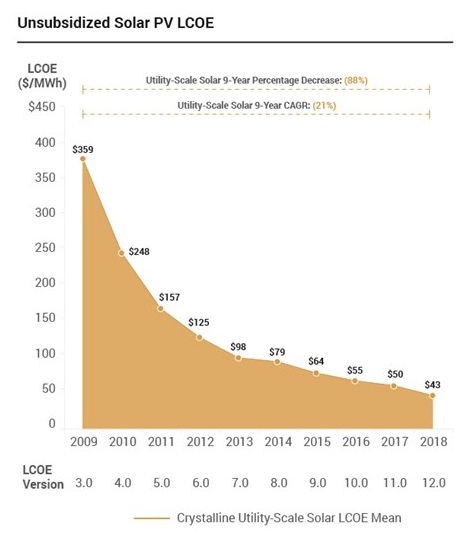
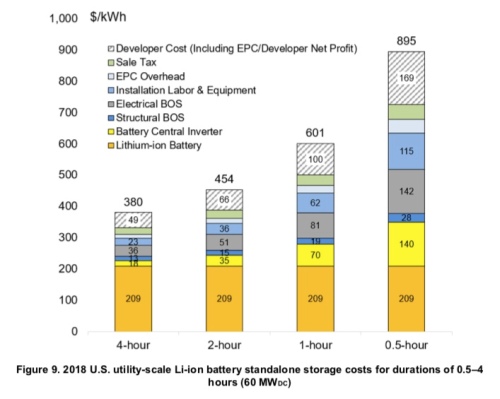
Critically, MacKay headed his calculation “fantasy time” since he felt the calculation rested upon an unrealistically high cost. Fortunately, this is one area where MacKay was wrong (and Seba right): those fantasy cost reductions have come true (from Bloomberg‘s New Energy Finance (BNEF)‘s New Energy Outlook 2018):

untitled

In short, MacKay was far too pessimistic when it came to the cost curve. BNEF calculates a learning rate of 28.5% for solar PV. The learning rate 28.5% means that every time production capacity for solar PV panels is doubled, the cost of those panels comes down by 28.5%. This is an example of a virtuous circle: lower costs spur greater demand for the panels, which spurs greater production, which spurs future cost cuts and thus greater demand — and so the cycle goes on. (Of course, the panels are not the only components that go into a utility sized solar farm and all the other components will have their own learning curves and, hopefully, declining cost curves. We will come back to that in a later post.)

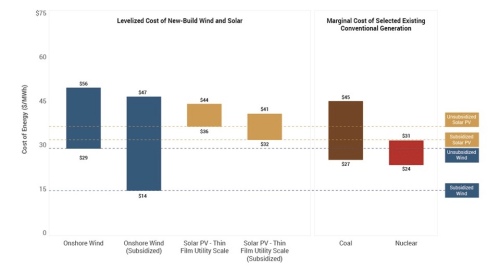
We are 10 years on from when MacKay wrote Without the Hot Air and already solar is overtaking all existing sources of fossil-fueled energy production in terms of cost competitiveness. Of course, there is a big caveat here: production costs are very different from the cost to deliver energy to a customer at a particular time and at a particular place as I have flagged above. Nonetheless, MacKay was worried about how solar stacked up cost-wise on a production basis out to 2050. That worry was misplaced.

How audacious is this plan? The solar power capacity required to deliver this 50 kWh per day per person in the UK is more than 100 times all the photovoltaics in the whole world. So should I include the PV farm in my sustainable production stack? I’m in two minds. At the start of this book I said I wanted to explore what the laws of physics say about the limits of sustainable energy, assuming money is no object. On those grounds, I should certainly go ahead, industrialize the countryside, and push the PV farm onto the stack. At the same time, I want to help people figure out what we should be doing between now and 2050. And today, electricity from solar farms would be four times as expensive as the market rate. So I feel a bit irresponsible as I include this estimate in the sustainable production stack in figure 6.9 – paving 5% of the UK with solar panels seems beyond the bounds of plausibility in so many ways.

A second observation (or criticism) is that MacKay seems to have also been too pessimistic in term of not just his cost assumption but also efficiency. In the above calculation, MacKay used 10% efficiency panels:

I assumed only 10%-efficient panels, by the way, because I imagine that solar panels would be mass-produced on such a scale only if they were very cheap, and it’s the lower-efficiency panels that will get cheap first.

In reality, those crystalline-silicon PV modules shown in the BNEF report above are far more efficient. From the United States Department of Energy:

Crystalline silicon PV cells are the most common solar cells used in commercially available solar panels…..

……Crystalline silicon PV cells have laboratory energy conversion efficiencies over 25% for single-crystal cells and over 20% for multicrystalline cells. However, industrially produced solar modules currently achieve efficiencies ranging from 18%–22% under standard test conditions.


True, these efficiencies are at the panel level not at the solar farm level. A utility scale solar facility will also need room for inverters, control panels, transmissions mechanisms, maintenance huts, security facilities and so on. Yet, we are already at around 20% efficiency levels for commercial products in 2019. Even if we knock off a few percentage points of efficiency to take account of ground cover occupied by stuff needed for a solar installation other than the panels, we are still far above MacKay’s efficiency figure.

A second area where MacKay was far too pessimistic with respect to the technology relates to the Shockley-Queisser limit. This limit sets the maximum theoretical upper efficiency limit of a single layer solar cell to around 33%. However, a new generation of multijunction cells has hopped over the Shockley-Queisser limit. With a two-layer cell your theoretical ceiling is 44% and with three layers 50%. The US National Renewable Energy Laboratory (NREL) shows the major improvements achieved in the past and those predicted for the future. The energy academic Varun Sivaram also devotes a chapter in his book “Taming the Sun” to these frontier PV technologies.

untitled

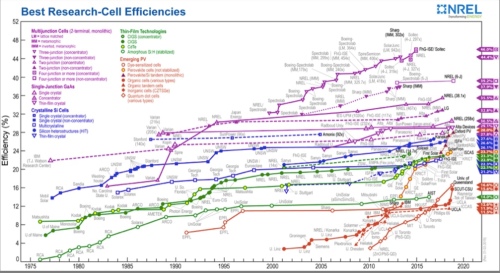
Currently, the really super-high efficiency panels that are up at 40% are not cost competitive enough to adopt for commercial use. Further, most have drawbacks in terms of manufacturing cells at sufficient size and also with respect to building cells durable enough to be deployed in real-world field conditions. Yet results to date suggest the more efficient panels have kept migrating out of the laboratory and into the marketplace at an ever-falling price.

Given where we are now in terms of panel efficiency and where we will likely be in 10 years time, it is possible that the 200 m2 of land allocated by MacKay to every UK citizen for solar panels could actually meet all the UK energy needs; that is, 125 kWh per person per day if we were deploying 25% efficiency panels (provided that the energy could be transferred though time and space). Further, once solar PV technology can be incorporated into roof tiles and road pavings, not all of the required space need be taken from agriculture land (figure below taken from Without the Hot Air“).

untitled

Then, of course, we could add energy generated from wind into our mix. Each additional kWh coming from wind energy means one less kWh needs to come from solar energy. Tony Seba’s focus was on solar, but I see solar and wind as inseparable twins.

Overall, Mackay was far too pessimistic over the ability of solar to come down its cost curve. In my next post, however, I want to look at an even more potent argument against the future primacy of solar. The blogger Euan Mearns and his co-contributor Roger Andrews are not huge fans of renewables and feel the displacement of solar is a pipe dream of green fantasists. We shall see what they have to say.


Seba’s Solar Revolution Part 2 (I Love Renewables. But I’m also Pro-Arithmetic)

For those interested in climate change and energy issues, the 2009 book “Sustainable Energy – Without the Hot Air” by Cambridge University Professor David MacKay published in 2009 was a revelation (made freely available online as well, and still there). MacKay provided a rigorous but accessible analysis of what it would take to wean the world off fossil fuels.

MacKay was no emotional ‘eco-warrior’ calling the faithful to arms, yet still a strong supporter of renewables. But every renewable or clean energy pathway explored in the book is deconstructed to check the validity of the underlying physics and maths. The book will have you recalling your high school science lessons, but in a fun and entertaining way. Despite it now being 10 years old, I still think “Without the Hot Air” remains a vital desk reference for anyone interested in climate and energy issues.

Tragically, MacKay died of stomach cancer at the far-too-early age of 48. The loss was even more telling as beyond his successful career in academia and his outreach into popular science, MacKay’s influence had extended into public policy sphere, resulting in him being appointed Chief Scientific Advisor to the UK Department of Energy and Climate Change in 2009.

To get an idea of MacKay’s approach to renewables, it is worth listening to his 2014 Ted Talk here. In his words: “I’m absolutely not anti-renewables. I love renewables. But I’m also pro-arithmetic”


With MacKay as my guide, we are now ready to interrogate Seba’s analysis. First thing is to choose our energy unit of measurement. As usual, the flagship energy statistics publications have their favourites, which differ. The International Energy Agency likes to use Mtoe (million tonnes of oil equivalent) while elsewhere we can find Mboe (million barrels of oil equivalent) and MBtu (million British thermal units). Throughout my blog posts on the electric vehicle revolution I focussed on kWh (kilowatt hours). Since MacKay also likes kilowatt hours, this makes life a bit easier. From Mackay’s TedTalk we also learn that the UK consumes an average of 125 kWh of energy per person a day (electricity, heat, transport, etc) and the USA about twice that at 250 kWh per person per day.

To help his audience get an intuitive grasp of what that amount of energy relates to he uses the image of a collection of light bulbs. Unusually, for MacKay, I didn’t think that was a great example since lightbulbs come in all sorts of energy efficiencies these days. But by doing a bit of basic maths backwards, it seems he is talking about 40 watt ones. So the maths goes like this: 40W equals 0.04kW. So if you leave it on for an hour, that’s 0.04kWh and multiply by 24 as its on all day or 0.96 kWh, so basically 1kWh. So 125kWh is equivalent to leaving 125 40W lightbulbs on all day.

Let’s fact check one of those numbers against primary sources just to make sure the daily  numbers are in the right ball park. The International Energy Agency (IEA)‘s publication “Key World Energy Statistics 2018” is one of the most authoritative sources of information in the energy field. On page 34, we find that total primary energy supply (TPES) in the United States in 2016 (latest data) was 6.7 tonnes of oil equivalent per person. That is for the entire year, so we need to change it into kWh and then make it per day. One tonne of oil equivalent is equal to 11,630 kWh (using the conversion tables in the same publication) or 31.9 kWh per day. Multiply, that by 6.7 and we get 213 kWh. That looks a little short, but then we need to adjust for the fact that, despite the fracking revolution, the USA is still a net importer of energy: around 10% is imported (see here). After this correction, we get 237 kWh per day. I think that is sufficiently close to 250 kWh to get a fact check seal of approval.

Now let’s fact check one of Tony Seba’s number using the same IEA report. As referenced in my last post, Tony has existing solar at 1.5% of global total energy production. The IEA report has global photovoltaic energy production at 328 terawatt hours in 2016.

untitled 4

The same report also gives total primary energy supply (TPES) at 13,761 million tonnes of oil equivalent. Note that the Other category at 1.7% includes not only solar but also wind, tidal and so on. So does solar dominate ‘Other renewables’?

untitled 4

To answer that question, first let’s check what 13,761 Mtoe in terawatt hours? Again from the IEA‘s conversion charts we get 1 Mtoe equal to 11.63 terawatt hours (TWh). Just as a gentle reminder we go watt, to kilowatt, to megawatt, to gigawatt, to terawatt, with each step change rising by a factor of 1,000.

Accordingly, 13,761 Mtoe equals roughly 160,000 TWh) (for a useful online unit converter see here). Divide that by 328 TWh gives us 0.2%! After this calculation, I decided I needed to fact check my fact checking, so I went away to find different sources. The renewables industry has its own multinational body called the International Renewable Energy Agency (IRENA). They put out at statistical yearbook (here).  From this we get a much more detailed statistical breakdown of the solar industry. But IRENA‘s numbers line up with the IEA. In 2016 according to IRENA, total solar energy production was 329 TWh split between 318 TWh as solar photovoltaic and 11 TWh as concentrated solar.

So Tony’s number for solar within global energy production appear to be out by a factor of five or more. So what could account for this? Some possible mistakes could be:

  • Confusing solar capacity with solar production
  • Mixing up electricity production with total energy production
  • Getting the conversion units wrong; for example, converting millions barrels (Mboe) of oil equivalent into terawatts instead of million tonnes of oil equivalent (Mtoe)
  • Using the overall non-hydro renewables number rather than that just for solar

All of the above would appear highly unlikely given Seba lives and breathes transport and energy economics. So if anyone has any ideas how one can get solar energy production to be 1.5% of the total I would love to hear from you.

At this point you may be wondering whether this is the end of this series of posts. If we are starting at 0.2% solar penetration of total energy production there is no way we will get anywhere near 100% in 2030. True, but if we take Seba’s two-year doubling metric, it only takes 8 years to go from 0.2% to 1.6% so his forecasts are only pushed out to 2038. That is still far more aggressive than any other forecast – and is still world changing. Plus wind power is going to do a significant portion of the heavy lifting in any energy transformation, a renewable source Tony strangely ignores.

And at the heart of Tony’s thesis is a truth: if costs compound down at an exponential rate, then penetration could compound up at an exponential rate. Interestingly, as I dipped back into my well-worn copy of MacKay’s “Sustainable Energy Without the Hot Air” there were certain instances where Tony’s simplistic analysis has been right and MacKay backed the wrong horse.

Before I wrap this post I also want to extract another number from the data we have: average energy production per person across the entire globe. In 2016, the world’s population stood at 7,466 million. From the IEA report above, we also know that energy production in 2016 was 160,000 TWh. Divide one by the other and we get 21,430 kWh. Divide that by 365 and we get 59 kWh per person per day.

With those numbers tucked under our belt, we are ready to look at land mass issues: a subject central to David MacKay’s analysis but one that barely features in Tony Seba’s.