
Over the last decade, the efficiency of solar panels has gone up and cost has come down. Accordingly, if we could move solar-generated electricity seamlessly through time and space, even a relatively poorly endowed country like the UK (in terms of solar irradiation and land availability) could meet its energy needs through allocating around 5% of its land mass to solar panels (as I discussed in my last post).
If the world were run by some kind of benevolent green dictator, he or she could possibly just issue a decree mandating a mass solar power build out which would replace all existing fossil fuel plants. In reality, the only dictatorship we face is that of ‘the market’. For solar to spread, therefore, the market must recognise solar as cheaper than existing fossil fuel alternatives.
Moreover, in order to reach a Tony Seba style 100% solar nirvana, solar must transition through a two-stage process. First, it needs to take out all the fossil-fuel competition with respect to new energy generation facilities to be built from now onward. Second, solar must push out all fossil fuel competition in the form of existing energy generation facilities. The first task is much easier than the second.
Energy generation costs are composed of two principal components: 1) the energy generating facility and 2) the ongoing operating and maintenance expenses. The second part is relatively easy to imagine. How much fuel and maintenance is required to produce X amount of energy, say a kilowatt hour (kWh) or megawatt hour (MWh)? For solar, the obvious answer to this question is “not much”. Once you have your panel set up, it just sits there generating electricity when the sun comes up every day. You may occasionally have to clean it and also prevent your local neighbourhood yob writing graffiti all over it or stealing the wires connecting it to the grid, but that’s about all. In economics speak, we describe this situation as one where the marginal cost of generating an additional kWh or MWh of electricity once a panel is in place is close to zero.
The marginal cost when producing 1 kWh or 1 MWh of electricity from a coal or gas-fired facility is, however, not zero since you need to put coal or gas in at one end to get electricity out the other end. For an automobile, you need to stick gasoline in at one end to get motion out the other end (in this case the via engine and the four wheels). Sorry, I know this bit is blindingly obvious.
The more complex bit of the LCOE calculation relates to the capital cost of the energy-generating plant required. For a utility scale solar farm, you will need to secure a large area of land (buy or lease), purchase the requisite number of solar modules, mount them, connect them up and then covert the electricity generated into a grid-compliant standard through the use of inverters and transformers. A 2017 report by the United States National Renewable Energy Laboratory (NREL) shows the cost breakdown of a variety of solar installations by size and also through time in the US.

Once we know the total cost of the installation, it can then be apportioned over all the electricity generated through the expected lifetime of the facility. Simplistically, the capital cost per unit of energy produced is combined with the operating and maintenance cost of each unit of energy produced to arrive at a single number: the levelled cost of energy (LCOE). The LCOE also takes into account how the project is financed and the time value of money. The NREL provides a more detailed explanation of the LCOE calculation here and also an LCOE calculator that you can play around with here. For those of you who don’t have a financial background and are not familiar with discounted cash flow (DCF) methodology, you can just think of the LCOE as the price at which a project needs to sell its electricity in order to breakeven and stay in business.
Accordingly, if a utility scale solar project has an LCOE of $40 per MWh (which is the same thing as 4 cents per kWh, the financial press switches between the two), then the owners will be very happy bunnies if they can sell their electricity at $50 per MWh. Likewise, an energy consumer may want to enter into a power purchase agreement (PPA) with an energy generator for a set amount of electricity over a set period of time. If a solar utility is offering to enter into the PPA at 4 cents per kWh while a coal-fired facility can only go down to 5 cents per kWh, you will likely go with the solar – other things being equal.
The wording “other things being equal” is critical. Presuming no battery storage is involved, the solar facility can only supply electricity during the day and nothing at night. A factory operating 24/7 needs electricity 24/7. If its weekly requirement is, say, 100 MWh the fact that the solar farm can deliver at $40 per MWh versus $50 for the coal-fired plant will not be a sufficient condition for it to win the contract since it can’t supply the electricity both day AND night. At times, Tony Seba and other commentators can be rather disingenuous in claiming that renewable energy is cheaper than fossil-fuel generated electricity for just this reason. Having an LCOE for renewables lower than that for fossil fuel plants is a necessary but NOT a sufficient condition for renewables to displace fossil fuel. As I stressed in my last post, a kWh or MWh of energy that is not located in time and space is a pretty meaningless concept.
That said, I am not suggesting that we throw LCOE out the window. For renewables to replace fossil fuels, we first need to get the LCOE of renewables below that of fossil fuels and then we need to open up the gap between the two. If solar is generating electricity at $40 per MWh and coal at $100 per MWh, then $60 per MWh is available to transfer the solar generated electricity through time and space. The money could be spent on some form of storage (time) or some form of connection (space). The bigger the gap, the bigger the incentive for markets to try and arbitrage away the cost difference through putting in place mechanisms to transfer energy through such time and space.
With all those caveats in place, it’s time to look at some LCOE numbers. A well-respected benchmark annual appraisal of competing LCOEs is published every November by the investment bank and asset management firm Lazard. The entire slide deck is well worth flipping through and you can find it here, but I will just extract three charts.
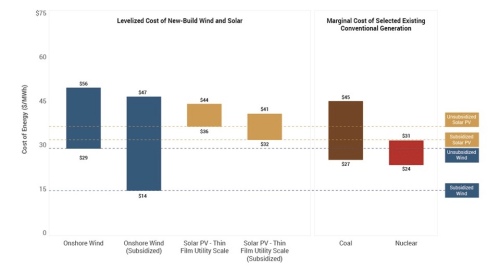
First up, you can see that for new build facilities, the LCOE of both wind and utility scale solar is now below that of gas combined cycle and coal. Accordingly, if we didn’t have any issues with respect to the provision of energy in time and space it would be cheaper to deliver all new energy generation through renewables.

Tony Seba’s claim, however, is that solar will not only be the energy generation vehicle for the future but it will also replace all the old fossil fuel facilities that have been constructed in the past. That is a much tougher hurdle. Remember the LCOE has two principal components: the ongoing operating and maintenance costs and the cost of the facility spread out over all the energy generated over the useful life of that facility.
When looking forward, the cost of building a brand new gas combined cycle or coal facility will be included in the LCOE number, when looking back it won’t. That is because that money has already been spent: it’s a sunk cost. So if solar is to mothball existing fossil fuel power stations, its LCOE must be cheaper that the LCOE of the gas or coal plant made up of the operating and maintenance (O&M) expense alone. The good news from Lazard’s November 2018 report is that wind and solar have got so cheap that they are starting to fulfil that condition as well. The cheapest solar facility at $36 per MWh is cheaper than a large proportion of coal-fired power stations whose operating and O&M costs are between $27 and $45 per MWh.
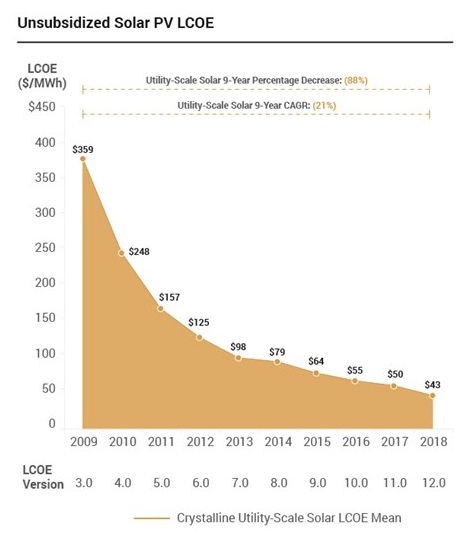
Even more encouraging is the fact that solar has been consistently coming down its cost curve just as Tony Seba predicted.
In addition, in areas of high solar irradiance we have seen 20 year power purchase agreements (PPAs) signed with solar utility scale projects at $20 per MWh or lower. The chart below shows the situation in the US, with new PPA price records being set in states like Arizona and Nevada (source: here). Presumably these PPA prices are higher than the projects underlying LCOE otherwise these projects would be loss-making and the solar utilities wouldn’t sign the agreements.

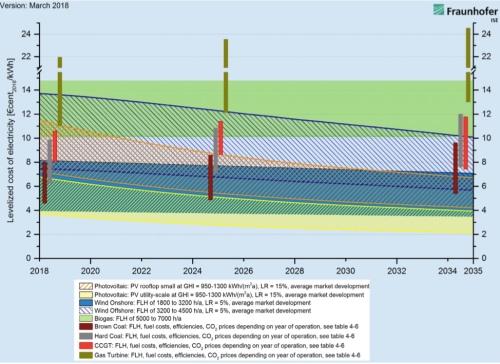
Fortunately, the cost declines have been such that even in countries with poorer solar irradiance profiles, like those in northern Europe, solar has become increasingly competitive. The chart below is taken from a report by the German Fraunhofer Institute for Solar Energy Systems (ISE). At the time of this post, one US dollar bought 0.87 euros. Keeping that exchange rate in mind, ISE forecasts that the cheapest utility scale solar installations will see their LCOE drop from 4 euros per MWh to 2 euros around 2032. At that price solar will be far cheaper than coal and combined-cycle gas turbine plants.
The upshot of this analysis is that countries that are well endowed in terms of solar irradiance already have solar plants that are cheaper than their fossil fuel competition on an LCOE basis, and countries that are less well endowed will see their solar plants winning out over the fossil fuel competitors on an LCOE basis over the next 10 years or so as solar costs continue to decline.
And now for some push back from the renewable energy skeptics Euan Mearns and Roger Andrews from the blog Energy Matters. In November 2018, Spain announced that it intended to move to 100% renewable generated electricity by 2050. Compared with Tony Seba’s claim of 100% solar by 2030 across the entire energy spectrum, it doesn’t seem so aggressive, but let’s put that to one side. In a post in November, Energy Matters took umbrage over the Spanish government’s claim and proceeded to show why such a target would be impossible to achieve.
At the heart of Energy Matters Roger Andrews’ argument is the claim that if we adopted renewables entirely to drive the electricity grid, it would become impossible to transport sufficient energy through time. Solar and wind’s intermittency would lead to large gaps in energy generation, and these gaps would be impossible to fill economically through the use of storage or by any other means. For his analysis, Andrews picked out the average electrical energy consumption and production patterns for two months in Spain: January and July. I will just concentrate on July here, but recommend you read the entire post to follow his argument from beginning to end. Here is the current contribution of renewables production to electricity consumption in July in Spain:

And after scaling up renewables production:

At this point, it’s worth reproducing the commentary accompanying this chart:
Obviously Spain plans to fill the hole with wind and solar. This approach has one thing going for it – the peaks and troughs in renewables generation are a good match to the demand peaks and troughs. But when we scale up July 2018 wind and solar generation (by a factor of 4.5) to match July 2018 demand we see that the amplitudes don’t cooperate.
Andrews then goes on to produce a chart showing the deficits and surpluses:

Which could only be equated by putting into place 1 terawatt-hours (1 TWh) of storage in his view:

In January, the mismatch is even worse with a requirement for 2 TWh of storage to solve the intermittency problem. Roger Andrews further speculated that potentially 5 TWh to 10 TWh may be required to achieve energy security across the entire year. As an aside, how much would a TWh of storage cost? If we are going to provide such storage via batteries, the RNEL in a recent reported issued in January 2019 estimates the cost of a 4-hour system at $380 per kWh.
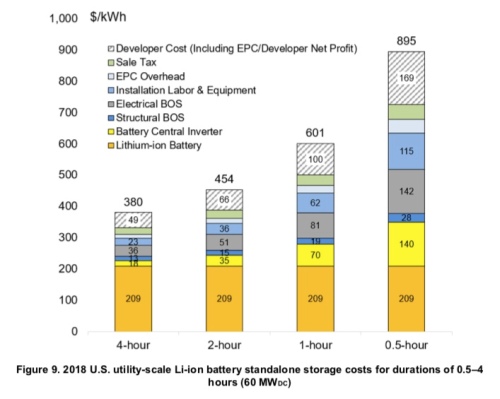
Unfortunately, a terawatt-hour is a billion times bigger than a kilowatt hour. So to provide 1 TWh of battery storage would cost $380 billion at current prices. So to get the amount of storage Andrews suggests, we need trillions of dollars. Given Spain’s gross domestic product was only about $1.3 trillion in 2019, buying trillions of dollars worth of batteries looks unrealistic. Of course, there are other storage options like pumped storage, which Andrews briefly considers, but these have major environmental impacts.
So has Roger Andrews thrust a dagger into Tony Seba’s dream of golden world of solar? Well, these Energy Matters posts are certainly thought-provoking, but if I had a criticism it would be that they suffer from an awful lot of confirmation bias. Andrews appears intent on skewering renewables at the outset and then builds his argument to achieve that end. Accordingly, he frequently makes assumptions in his calculations that look somewhat dubious. In my next post, I will subject Roger Andrews’ skepticism to bit of my own skepticism to see if we can resurrect Tony Seba’s dream .


Isn’t the LCOE of solar heavily dependent on financing costs and the cost of land? My guess is that providing lower-cost financing would benefit solar much more than gas. What would the land cost contribute in cents per kWh to cover 5% of the UK with solar farms?
Robert: There is a nice new slide deck (December 2018) out from the UK Solar Trade Association (STA) that gives up-to-date LCOE figures for the UK. One of the most interesting take-aways is that the STA itself appears quite surprised at how quickly LCOEs have come down (they compare their current forecasts with previous ones done in 2014).
Click to access Cost-reduction-potential-for-large-scale.pdf
For land, STA assumes it is leased in their calculations and surprisingly the leasing costs is a relatively modest component of operating costs. Comments don’t allow me to paste in the relevant chart, so look at the ‘OPEX assumptions’ slide.
Given CapX is likely to be a much larger part of LCOE for solar than OPEX, I would guess you are right that solar would be more sensitive to the cost of financing. There is another slide in there showing the weighted cost of capital (WACC) ranging from 4% to 11%.
I aim to first do a deep dive for Germany rather than the UK in terms of how far solar (and wind) can expand given that Germany has the most coherent renewable strategy and there is so much written about the energiewende by both renewables lovers and haters.
The IEA have come out with a commentary on the matter:
https://www.iea.org/newsroom/news/2019/february/is-exponential-growth-of-solar-pv-the-obvious-conclusion.html
Nice post on the track record of the IEA:
https://steinbuch.wordpress.com/2017/06/12/photovoltaic-growth-reality-versus-projections-of-the-international-energy-agency/
I agree with your criticism of the Energy Matters blog (“that they suffer from an awful lot of confirmation bias. Andrews appears intent on skewering renewables at the outset and then builds his argument to achieve that end.”)
The obvious problem in this particular instance is that batteries are used for long term storage.
Let me quickly correct my last sentence. There is no mention of batteries in this instance at Energy Matters as the long term storage option, simply a claim that there is no viable option apart from storage hydro, and that that is not viable either in Spain, at least in sufficient quantity.
Of course, I do still not agree with his basic conclusions. I think that Spain can meet a 100% renewables target in 2050 without large cost increases. The quality of the Energy Matters modelling regarding the matter is rather poorer than the papers I linked to in my previous comment.
Heiko. I do agree with you. However, in another Energy Matters post on Germany they explicitly do try to use batteries to bridge the gap, but I want to look at that argument when I post on Germany. The problem with blogs like Energy Matters is that although they may engage in poorer modelling than what you would see in academic papers, such blogs frequently frame much of the agenda for public discourse. This is similar to Anthony Watts highly influential “Watts Up with That” climate-skeptic blog on climate change. Most people, including journalists, find peer-reviewed academic papers unintelligible, so the battle for political ideas is fought through blogs, web sites, social media and so on.
I had to do a little bit of digging, but now I have the numbers. Spain is particularly suited to 100% renewables, because it is well endowed with solar, wind and hydro resources. For solar and wind, this is readily apparent when looking at https://github.com/PyPSA/WHOBS
In that simple modelling exercise, which just considers solar, wind, batteries and for long term storage hydrogen, Spain comes out as the country with the lowest cost in 2030 and 2050.
They do not consider hydro, which is kind of handwaved away by Energy Matters (surely they cannot supply sufficient energy, if ever there is a situation where any coal gets used at present …)
Click to access hydro_report_final-2011-160-0011-01-e.pdf
file:///home/chronos/u-1923cbad6496fa78866887cf79ef6243f80652eb/Downloads/verbund-hydropower-study-main-report.pdf
Pumped hydro storage capacity is 1500 GWh (Fig. 8 of the first link) in Spain, and storage hydro comes in at about 20 TWh in Iberia (page 19 of the second link).
There are some really nice charts there Heiko. Thanks for flagging that. The use of hydrogen as a storage medium deserves a post to itself down the line and I’ll definitely incorporate that reference. But remember Seba’s argument is that solar will win out without a Green New Deal but purely on cost competitiveness alone. I still haven’t made up my mind whether that is a feasible forecast (although I don’t see it happening by 2030). Just as with my series on electric vehicles, I am trying to do the posts in bite sized chunks. It is such a vast and complicated subject. Just like my EV posts, I see the solar ones ballooning in number, but will try to cover all the issues you raise.