
If you follow the climate change debate over time, it is difficult not to get depressed: it’s the feeling of helplessness as the slow-motion cash crash takes place before your eyes.
So when a little bit of light shines through, it comes as a relief. And sometimes, hope comes from the most unlikely of sources–in this case China. It is almost a truism that as go China’s CO2 emissions, so go the world’s. See the chart below (Source: Trends in Global C02 Emissions Report; click for larger image):

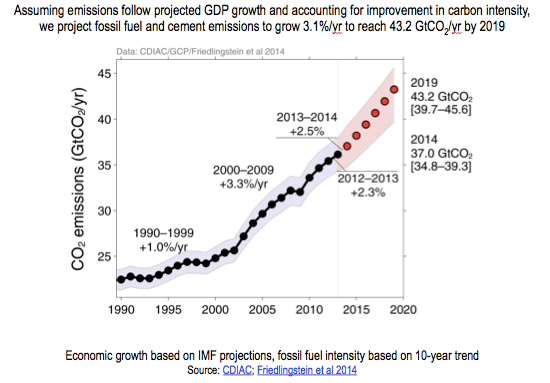
Very roughly, global CO2 emissions have gone from around 24 billion tonnes per annum in the early 1990s to around 36 billion tonnes today: an increase of 12 billion, or 50%.
Taking the top six emitters, we see can China’s prime role in this growth more clearly (click for larger image):

So we have seen China move from emitting around three billion tonnes of CO2 in the 1990s to around 10 billion tonnes today. Thus of the extra 12 billion tonnes of CO2 emitted per annum globally after 20 years, 7 billion has come from China.
The Global Carbon Project sees emissions continuing to grow to 43 billion tonnes in 2019 (note giga is equivalent to billion).
And again it is China leading the trend:

And keep in mind that we have a CO2 budget of around 1,200 billion tonnes of CO2 before we commit the earth to 2 degrees Celsius of warming with a 66% probability. On current trends, that budget will be used up by about 2041, or in around 27 years.

Over that period, China is likely to emit approximately 15 billion tonnes of CO2 per year on average on present trends. That would mean that by 2041, China would have emitted about 400 billion tonnes of CO2, or a third of the total budget available. Next question: is there any way China can free up more of the budget?
A paper by Luukkanen et al provides us with a detailed decomposition of China’s future emissions using a Kaya identify with a sectoral overlay. To refresh your memory, the Kaya identity allows us to estimate future emissions based on population growth, GDP growth per person, energy intensity per unit of GDP, and carbon intensity per unit of energy (see my post “The Unbearable Logic of the Kaya Identity” for a little more detail).
The paper sets out three fuel-related emission scenarios: reference (business as usual), policy (following the government’s developmental plans) and industry (a focus on heavy industry and investment-led growth).

Note that the above charts are only looking at fuel combustion emissions. Accordingly, these numbers don’t tally with the Global Carbon Budget numbers that also add in agriculture and industry-related emissions. Nonetheless, where fuel emissions go, so will total emissions.
Here is where the silver lining comes: the most-muted emissions scenario above, termed ‘policy’, still looks far too high growth-oriented to me. Here are the assumptions that underpin this scenario `click for larger image):

In the policy scenario, a GDP growth rate of 7.4% is still forecast between 2016 and 2020, and then 5.2% growth between 2021 and 2030. If you believe in a much quicker slow-down scenario, which I do, then these numbers look hopelessly optimistic (from a growth rather than climate perspective). See my post referring to Michael Pettis’ work.
If you then combine a much swifter descent to growth rates of 3-5%, plus a continued pivot from investment-led growth to consumption-led growth, and then add on an aggressive renewables roll out (which we are seeing), then China could free up an additional 100 billion tonnes of the carbon budget.
Frankly, that still doesn’t get us anywhere near capping climate change to 2 degrees of warming, but it gives us a little bit of extra time. And given where we are, every little bit helps.


I note that in your Kaya Identity post from two years ago we then had 40 years until we used up our carbon budget; this post indicates 27 years until we use up our CO2 budget. I know that carbon emissions have increased in the last two years, but that is quite and acceleration forward of C-Day, the day when emissions must cease.
Do the carbon and CO2 budgets match? Do they include other greenhouse gases as carbon equivalents? Do they include emissions that cannot be reduced, such as those from agriculture?
I think Kevin Anderson of the Tyndall Centre has proposed an even more accelerated schedule for implementing warming gas reductions. What’s your latest take on his work?
Joe., the carbon budget methodology is a great way to measure the extent of the challenge, but it is imprecise. In the original post, I just took a 433 billion carbon (not CO2) budget and then divided by the then annual emission of 10.7 billion tonnes of carbon at that time. Divide one by the other and you roughly get 40 years. But then I noted that we were likely to get emissions growing at 2% per annum (via the Kaya identify) meaning the budget would be used up a lot more quickly than 40 years.
In that post I worked in units of carbon because I started with Myles Allen’s trillion tonnes total budget and the CDIAC emission numbers. This time I’ve stayed in tonnes of CO2 just because the post is hooked onto papers working with those units. You can go back and forth between units multiplying or dividing by 3.67.
I’ve looked at Kevin Anderson’s work in the past, particularly his papers on 4 degrees of warming. I probably need to revisit his latest stuff. You can easily get a time line of less than 25 or so years by a) changing your climate sensitivity number, b) changing your emission growth number or c) changing your risk window from say a 66% probability of staying within 2 degrees to a 90% one. You can also get pretty gloomy if you take into account emissions lock-ins; i.e., fossil fuel plants that have already been built and are unlikely to be mothballed any time soon.
In terms of my own gloominess, I think we will really struggle to stay below 2 degrees, but it is not all doom and gloom that we will certainly get to 4 degrees. That said, in the process of moving toward, and then past, 2 degrees, we are so much more vulnerable to Rumsfeld’s “unknown unknowns”.
The Global Carbon Project chart forecasting emissions growth of +2.5%/year is sobering. (Plus, their name reminds me of ‘The Human Project’ in the film ‘Children of Men’.) It needs to be -2.5%. As far as I know, no country has managed less than -1%/year over an extended period. Sweden and the UK must be close to that. Renewables are doing well, the big stumbling block is efficiency (ie electrification). The studies I have seen forecast very modest uptake (eg of electric cars and heating) by 2050. It would be great if there were some region trying to do radically better to show us what is possible.
Robert
Jorgen Randers, one of the original authors of “Limits to Growth” tried to do just that (from the Guardian)
“He has personal experience of this, having chaired a commission in Norway that in 2006 came up with a 15-point plan to solve the climate problem if every Norwegian was willing to pay €250 (£191) in extra taxes every year for the next generation or so.
If the plan had been given the green light, it would have allowed the country to cut its greenhouse gas emissions by two-thirds by 2050 and provide a case study other rich countries could learn from.”
It didn’t work out well:
http://www.theguardian.com/sustainable-business/2015/jan/19/davos-climate-action-democracy-failure-jorgen-randers
And if you want to get really depressed, read his 2012 book “A Global Forecast for the Next 40 Years”.
Interesting article in the Guardian. I don’t blame Randers for being skeptical that anything will be done. By the time the consequences are obvious to everyone, it will be far too late to do anything. It probably already is.
I took Limits to Growth very seriously, watched the dramatic effects of the 70’s oil shocks, took heart when Carter seemed on the right track and then watched in dismay as “Morning in America” rejected the whole concept of any limits to growth.
Even so, I have spent much of my work life in renewable energy research and application, hoping against hope that someday the ‘call’ would come, and that fossil fuels would be phased out as huge amounts of renewables were phased in. I now believe, like Randers, that it will never happen.
Right now I think the only thing that will ensure that there will be a habitable planet for my new grandson will be a financial crisis and economic collapse. It’s a sorry day when one has to hope for catastrophe, but that day is here.
Fortunately the odds are fairly good that economic collapse will happen soon enough to reduce our carbon emissions and prevent catastrophic warming. This is where I disagree with Randers. He thinks the market economy can be kept functioning until 2050 or so, ensuring very high CO2 levels. We shall see.
The Randers article in interesting, thanks for that. I can see how he would be becoming a little disillusioned after so long. I had been thinking along similar lines myself, not so much that there is an intrinsic problem with democracy per se (or even with how it is practiced today), but with a more fundamental problem in the relationship between the present, the future, and human nature. Who wants to do anything for the future? We can see this even in Anglo countries with their very low savings rates, even though there is a pretty broad consensus that investing more now would make everyone better off in the future – the problem is we just don’t want to. (I live in New Zealand, a country that hasn’t run a current account surplus since 1973.)
His specific suggestions,
1. Educate people about the risks of short-termism,
2. Use low discount rates, common sense, and rules of thumb to encourage long-term investments,
3. longer election cycles,
4. decent unemployment benefits for those losing “dirty” jobs,
5. brief period of enlightened dictatorship,
may well be reasonable (except the last), but they make me think he is getting a bit too pessimistic, possibly because of the failure of his own scheme. He is tending towards those who think climate change can’t be tackled without a complete reorganization of society. People who have succeeding in getting something done, like David King, who persuaded the UK to adopt an 80% reduction by 2050 target, tend to be more optimistic. Haven’t all EU countries now adopted targets in the 80-100% range? (It will be interesting to see their detailed plans, once they are ready.)
Much simpler tools, such as a carbon charge and dividend, are already available now. The editors at cleantechnica (optimists bordering on cornucopians) think a carbon charge of as little as $70/ton would be enough to displace coal for electricity.
However your main point, that a fall in global GDP growth by 1 or 2%, would help cut emissions, is a good one. And not only because of China – surely rising inequality in the US, and the continuing debt crisis, will lower growth in the US and EU.