The University of Alabama-Huntsville (UAH) global average lower tropospheric temperature anomaly for May 2013 was released via the web site of Dr Roy Spencer (one of the founders of the programme that produces this temperature time series) on June 4th. The anomaly refers to the difference between the current temperature reading and the average reading for the period 1981 to 2010.
May 2013: Anomaly +0.07 degrees Celsius
This is the 13th warmest May temperature recorded since the satellite record was started in December 1978 (34 May observations). The warmest May to date over this period was May 1998 (1998 being the super El Niño year), with an anomaly of +0.58 degrees Celsius.
As background, five major global temperature time series are collated: three land-based and two satellite-based. The most high profile satellite-based series is put together by UAH and covers the period from December 1978 to the present. Like all these time series, the data is presented as an anomaly (difference) from the average, with the average in this case being the 30-year period from 1981 to 2010.
The official link to the data at UAH can be found here, but most months we get a sneak preview of the release via the climatologist Dr Roy Spencer at his blog.
Spencer, and his colleague John Christy at UAH, are noted climate skeptics. They are also highly qualified climate scientists, who believe that natural climate variability accounts for most of recent warming. If they are correct, then we should see some flattening or even reversal of the upward trend within the UAH temperature time series. To date, we haven’t (click for larger image):
One of the initial reasons for publicising this satellite-based data series was due to concerns over the accuracy of terrestrial-based measurements (worries over the urban heat island effect and other factors). The satellite data series have now been going long enough to compare the output directly with the surface-based measurements. All the time series are now accepted as telling the same story (for a fuller mathematical treatment of this, see Tamino’s post at the Open Mind blog here). Note that the anomalies produced by different organisations are not directly comparable since they have different base periods. Accordingly, to compare them directly, you need to normalise each one by adjusting them to a common base period.
On the front page of this blog is my candidate for the most important risk indicator in the world: the atmospheric concentration of CO2 (currently at around 398 parts per million, or 42% above the pre-industrial level of approximately 280 ppm).
The degree to which the world’s temperature responds to a rise in atmospheric CO2 is captured in a metric called ‘equilibrium climate sensitivity’. This sensitivity number is an estimate of how much global mean temperature will rise should atmospheric CO2 concentration double (in other worlds rise to 560 ppm) such that the heat going into the earth system is back in balance with the heat emitted from the earth system; i.e, the attainment of a new equilibrium.
To put this number is context, the global community has (somewhat arbitrarily) taken a rise of 2 degree Celsius in global mean surface temperature to be regarded as the threshold beyond which the world will experience dangerous climate change. So the critical question then becomes: at what level of CO2 in the atmosphere will we become committed to 2 degrees Celsius plus of warming? By extension, should our best estimate of equilibrium climate sensitivity be 2, then we will cross the dangerous climate threshold of 2 degrees of warming only if we double atmospheric CO2. If the equilibrium sensitivity number were 3, we would cross the dangerous climate change threshold at a far lower level of atmospheric CO2. In short, a low sensitivity number is good, a high one bad.
In 2007, the Intergovernmental Panel on Climate Change (IPCC) published its latest estimate for equilibrium climate sensitivity in its Fourth Assessment Report (AR4). This report is taken by policy makers to be the consensus view of climate scientists at a particular time. And here is the best estimate as of 2007:
Equilibrium climate sensitivity is likely to be in the range 2°C to 4.5°C with a most likely value of about 3°C, based upon multiple observational and modelling constraints. It is very unlikely to be less than 1.5°C.
Surprisingly, despite a plethora of papers and the advancement of computer modelling, the climate sensitivity number has hardly moved over the years. But we now appear to have the makings of a new consensus that the climate sensitivity number may be somewhat lower than the 3 degree best estimate agreed upon in 2007.
If true, this is certainly good news and should be applauded. The latest paper supporting a slightly lower climate sensitivity number is that of Otto et al., which was published in Nature Geoscience. Unfortunately, the original paper is behind a paywall, but, realising the importance of the paper, Nature has published an open access synopsis (which they term Supplementary Information) that can be found here.
One of the authors of the study is Nic Lewis, who has previously published work suggesting a much lower equilibrium climate sensitivity number than in the IPCC’s 2007 report. Lewis stresses (here) the credentials of the authors in the new Nature Geoscience paper, including the fact that many of them are deeply involved in the creation of the IPCC’s Fifth Assessment Report (AR5), to be published in 2014:
The authors include fourteen climate scientists, well known in their fields, who are lead or coordinating lead authors of IPCC AR5 WG1 chapters that are relevant to estimating climate sensitivity. Two of them, professors Myles Allen and Gabi Hegerl, are lead authors for Chapter 10, which deals with estimates of ECS and TCR constrained by observational evidence. The study was principally carried out by a researcher, Alex Otto, who works in Myles Allen’s group.
In sum, this is a legitimate paper and doesn’t emanate from a closet libertarian fruitcake or some embittered contrarian loon who was passed over for tenure.
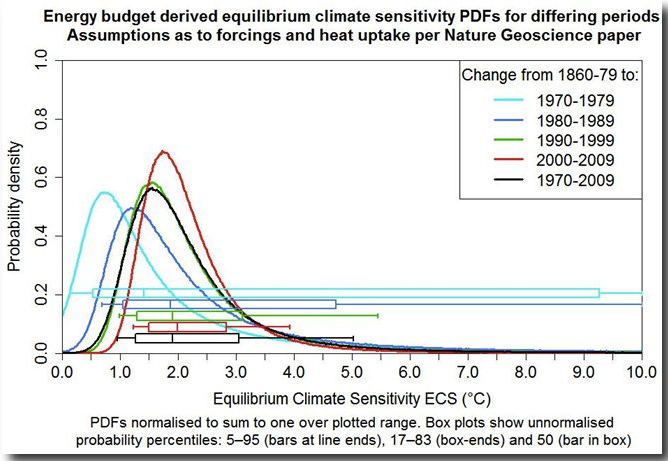
Lewis has also helpfully produced a graphic showing the climate sensitivity estimates based on various observational periods (as to why he is putting this onto the climate skeptic blogs Bishop Hill and Watts Up With That I can’t quite fathom):
Helpfully, the graphic also contains box and whisper plots, which Lewis describes thus: Continue reading →
The University of Alabama-Huntsville (UAH) global average lower tropospheric temperature anomaly for April 2013 has been released via the web site of Dr Roy Spencer (one of the founders of the programme that produces this temperature time series). The anomaly refers to the difference between the current temperature reading and the average reading for the period 1981 to 2010.
April 2013: Anomaly +0.10 degrees Celsius
This is the 11th warmest April temperature recorded since the satellite record was started in December 1978 (34 April observations). The warmest April to date over this period was April 1998, with an anomaly of +0.66 degrees Celsius.
As background, five major global temperature time series are collated: three land-based and two satellite-based. The most high profile satellite-based series is put together by UAH and covers the period from December 1978 to the present. Like all these time series, the data is presented as an anomaly (difference) from the average, with the average in this case being the 30-year period from 1981 to 2010.
The official link to the data at UAH can be found here, but most months we get a sneak preview of the release via the climatologist Dr Roy Spencer at his blog.
Spencer, and his colleague John Christy at UAH, are noted climate skeptics. They are also highly qualified climate scientists, who believe that natural climate variability accounts for most of recent warming. If they are correct, then we should see some flattening or even reversal of the upward trend within the UAH temperature time series. To date, we haven’t (click for larger image):
One of the initial reasons for publicising this satellite-based data series was due to concerns over the accuracy of terrestrial-based measurements (worries over the urban heat island effect and other factors). The satellite data series have now been going long enough to compare the output directly with the surface-based measurements. All the time series are now accepted as telling the same story (for a fuller mathematical treatment of this, see Tamino’s post at the Open Mind blog here). Note that the anomalies produced by different organisations are not directly comparable since they have different base periods. Accordingly, to compare them directly, you need to normalise each one by adjusting them to a common base period.
I would hope that if the chart keeps showing a line rising up to the right—and old records keep getting broken—then Spencer and Christy will admit that their hypothesis is wrong. Unfortunately, my gut feeling is that they will take their opposition to the idea of significant anthropogenic global warming to the grave. The physicist Max Planck once said
A new scientific truth does not triumph by convincing its opponents and making them see the light, but rather because its opponents eventually die, and a new generation grows up that is familiar with it.
This is frequently paraphrased, rather cynically, as “science advances one funeral at a time”. It is unfortunate, however, that we do not have the time to let opposition to concrete action to prevent climate change die off in a decade or two. By then, dangerous climate change will likely already be locked in.
Around 10 days later than usual, the March CO2 numbers are now out! Key numbers relating to NOAA’s April 17th release of March 2013 mean monthly CO2 concentration are as follows:
March 2013 = 397.34 ppm, +2.90 ppm year-on-year
Twelve Month Average = 394.53 ppm, +2.44 ppm year-on-year
Twelve month average over pre–industrial level = +40.9%
Atmospheric CO2 concentration is the world’s leading risk indicator. Every month, the National Oceanic and Atmospheric Administration (NOAA), a U.S. government federal agency, releases data on the concentration of atmospheric CO2 as measured by the Mauna Loa Observatory in Hawaii. The official NOAA CO2 data source can be found here.
This is the longest continuous monthly measurement of CO2 and dates back to March 1958, when 315.71 parts per million (ppm) of CO2 was recorded. The Intergovernmental Panel on Climate Change (IPCC) uses the year 1750 as the pre-industrialisation reference point, at which date the atmospheric concentration of CO2 was approximately 280 ppm according to ice core measurements.
Atmospheric CO2 displays annual seasonality: concentrations decline from the spring during the growing phase of terrestrial vegetation and rise in the autumn as vegetation dies and decomposes. The cycle is dominated by the northern hemisphere growing season since the northern hemisphere contains over 65% of the globe’s land mass. The cyclical pattern can be seen in the following chart (red line). The black line is the adjustment for seasonality.
The peak for atmospheric CO2 concentration is generally in the month of May. Based on past season cycles, we will likely reach 399 ppm in May 2013 and cross the 400 ppm mark in 2014. The rise in annual CO2 is due to fossil-fuel emissions and land-use change. However, there also exists some minor non-seasonal year-to-year variation related to weather, drought, fire, ocean current changes and volcanic eruptions.
To achieve the ultimate objective of the Convention to stabilize greenhouse gas concentration in the atmosphere at a level that would prevent dangerous anthropogenic interference with the climate system, we shall, recognizing the scientific view that the increase in global temperature should be below 2 degrees Celsius, on the basis of equity and in the context of sustainable development, enhance our long-term cooperative action to combat climate change.
The consensus best estimate is that a CO2 concentration of 450 ppm should not be surpassed in order to have a chance of keeping the increase in global mean temperature below 2 degrees Celsius. The current atmospheric CO2 trend suggests that the 450 ppm concentration and, subsequently, 2 degree Celsius threshold will be substantially exceeded.
Over the last few days, one of my favourite bloggers, Stuart Staniford of Early Warning, has done a couple of posts looking at the impact of climate change on food production. I generally agree with most of what Stuart writes, but on this occasion I have a number of major caveats. Indeed, I think his analysis paints a far too rosy picture of agricultural production in an era of climate change.
Before we start, we need to be a little careful about equating extreme weather with climate change. Given that we are in the foothills of global temperature rise, we can’t specifically assign particular events to climate change. The whole question needs to be looked at in probabilistic terms. Here is Bob Corell, Jeff Masters and Kevin Trenberth writing an opinion piece in Politico after Hurricane Sandy.
Overall, we know that climate change has stacked the deck so that this kind of event happens more frequently. That answer, however, prompts a deeper, more unsettling question that many want to know: is climate change worsening some recent extreme weather events like super storm Sandy? The short answer is yes. Climate scientists broadly agree that the extreme weather we’ve seen over the past few years is exactly what we’d expect to see in a changing climate.
So while we can’t definitely say that climate change is responsible for recent extreme weather events that have disrupted food production, we can say that climate change makes such events more likely and more extreme.
Nonetheless, for the sake of argument, let’s just hypothesise for a minute that recent extreme weather events such as the droughts in Australia, the U.S. and Russia are due to climate change. I will run with this assumption because Stuart appears to be claiming that regardless of how we categorise recent extreme weather events, they are not showing up in the agricultural production data—or, ultimately, in people’s stomachs.
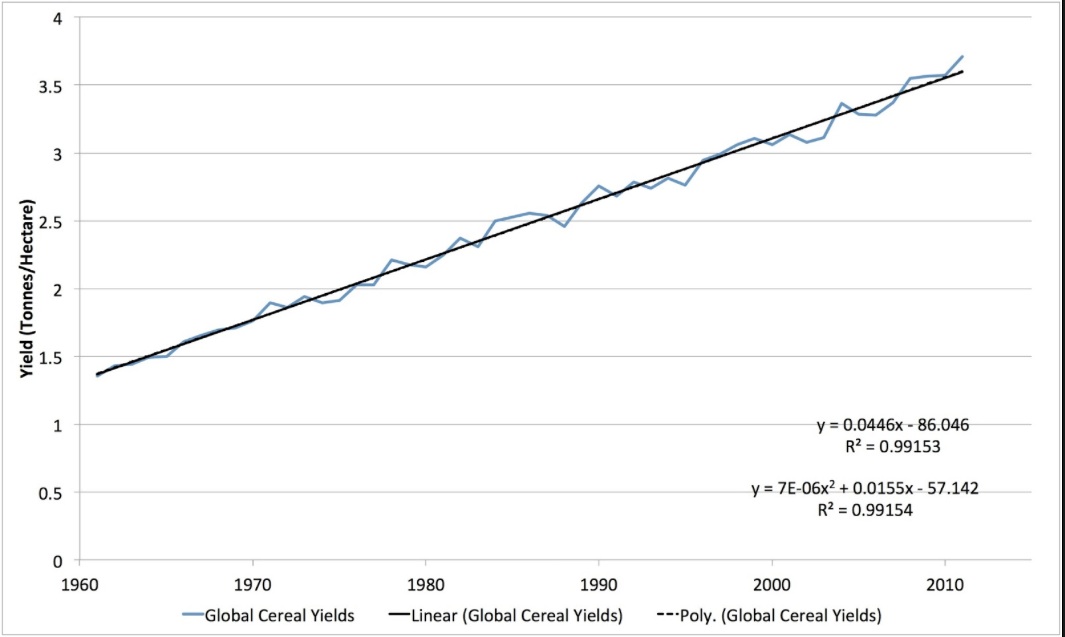
So, clearly, the overwhelming story in global agricultural yields is this: improving agricultural technology has increased yields at a steady, reliable pace – they have more than doubled over the last 50 years. There just is absolutely no support in the data for the idea that climate change, or any other negative or scary factor you care to name – eroding soil, depleting aquifers, peaking oil supplies – is causing the agricultural yield curve to start bending downward. Maybe they will in the future, but it sure isn’t happening yet.
And he updates and republishes this chart to reinforce the point:
Which allows him to reach this conclusion which does not just cover yields but also overall production:
Climate change is scary, we are clearly melting the north pole, droughts and floods and heat waves are increasing over time. However, so far, it’s not hitting us where it would really hurt: in the stomach.
The chart looks like compelling evidence that climate change is not showing up in food production, but there are a number of problems. Continue reading →
In U.K. policy circles, it has become increasingly fashionable to believe that we can rely on natural gas as a bridge fuel to a non-carbon energy nirvana some time in the indeterminate future. In the meantime, let’s dump renewables: just too expensive.
Shale oil and gas were not the result of any radical technological revolution, but rather of a combination of advances in seismic information technologies, horizontal drilling and the ability to split open rocks at depth. Why did it happen? Part of the answer is the incremental process of innovation, combined with rising prices of oil and gas innovation plus markets.
Innovation plus markets: truly the neoclassical saviour of all our ills (and don’t forget that fracking technology was born out of government financed R&D, tax credits and infant industry support; see here). My frustration with this line of argument is that it claims to be based on markets, but makes no reference to actual market prices and volumes. If ‘innovation plus markets’ is our salvation then gas volumes will rise and prices will fall (or at least go sideways). Simple really.
In short, we now have a testable hypothesis: the hypothesis being that the bridge fuel of natural gas at the right price and volume will part the Red Sea and give us 20 or so years of R&D time to transcend fossil fuels altogether. So, Dieter, give us a price and volume number to test your hypothesis. I search within his book “The Carbon Crunch” in vain. Some solid numbers to buttress his assertions: not a chance!
Meanwhile, Helm also says it would be nice to have a carbon tax (it would be nice if we could have peace on earth too, and the lamb lie down with the lion and….well, you get my drift).
Overall, his argument goes like this: gas should get sort of cheaper and therefore get sort of more plentiful, and therefore we sort of use less coal, and so we sort of don’t need so many renewables (which are expensive anyway), and R&D should sort of possibly come up with non-carbon energy alternatives at some vague time in the future. And meanwhile we sort of manage to introduce a carbon tax.
This must be the most pathetic policy prescription in the history of academia.
So what is actually frigging happening. First, U.S. natural gas production is going sideways. I blog on this each month.
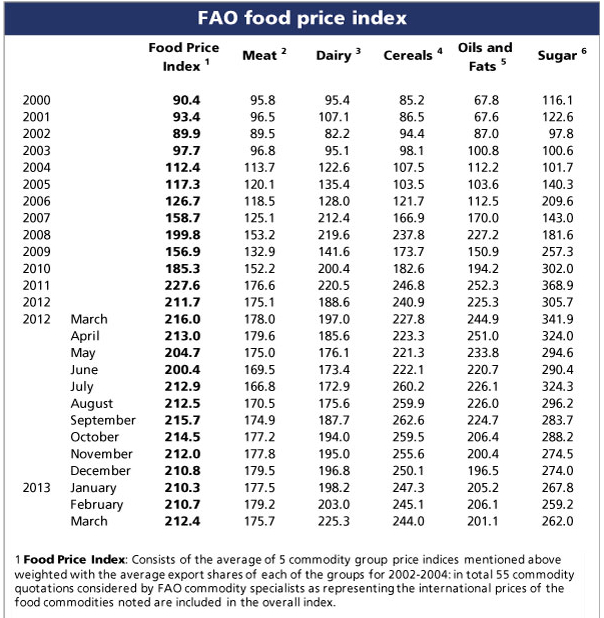
At the beginning of each month, the Food and Agriculture Organisation of the United Nations (FAO) releases a series of price indices for a variety of food commodities (here). The headline FAO Food Price Index is a composite of five food groupings: meat, dairy, cereals, oils and fats and sugar. The base 100 is the indexed averaged price for the 2002-2004 period. The March 2013 index number was released on April 11th. Key points are as follows:
The FAO Food Price Index averaged 212.4 for March 2013
The index was down 3.6 points from 216.0 for March 2012, or 1.7 in percentage terms
In inflation adjusted terms, the Food Price Index stood at 141.0 for March 2013 against the 2002-2004 base of 100
The nominal and real price indices have followed a trajectory not dissimilar to the global oil price (click chart for larger image). Here is food:
Finally, price developments within the five main components of the Food Price Index can be seen below. The most noted change this month is the surge in dairy prices, up 11% in a single month due to dry weather in New Zealand.
Margaret Thatcher leaves a mixed legacy on climate change. As an original climate hawk, she was instrumental in helping to launch the Intergovernmental Panel on Climate Change (IPCC) back in 1988 and also in promoting the U.K.’s climate change research capabilities though the foundation of the Met Office Hadley Centre for Climate Change in 1990. You can get a taste of her early stance in this short video here:
In her later writings, however, she recanted and became a hero to the climate skeptic cause.
Thatcher’s original engagement came via the career diplomat Sir Crispin Tickell. In 1975, Tickell took a sabbatical at Harvard University during which he first became acquainted with the science of climate change (although as an undergraduate he studied Modern History at Oxford). His interest in the subject culminated in the publication of a book called “Climate Change and World Affairs”. This is now out of print, but you can find an article summarising his ideas in the April 1986 edition of the scholarly publication Eos, Transactions American Geophysical Union here. Even today, the article appears quite fresh; for example read the conclusion:
The measures proposed may seem puny in relation to the problems that we face. Even such measures present major difficulties, and agreement on them may not be feasible until the need becomes more manifest. Yet the hazards of inaction are very real. The pleasantly warm moment that we now enjoy will not last for ever. The world itself is changing, partly through our own actions, and we face intimidating responsibilities as a result. We have no option but to meet them.
Tickell was asked by Thatcher to become Permanent Secretary in the Overseas Development Administration in the early 1980s. Subsequently, he caught Thatcher’s attention during a flight to Paris in 1984. She had asked whether the assembled officials around her had any agenda ideas for the next G7 meeting to be held in London. Tickell proposed climate change and as a result was invited the next day to Downing Street to brief Thatcher on his ideas. From then on, he advised Thatcher on various environmental issues on an informal basis. In an interview given as part of Churchill College’s British Diplomatic Oral History Programme (BDOHP), Tickell stressed how Thatcher was drawn to scientific topics given her background. (For an in-depth piece on how Thatcher’s scientific background influenced her policy making see this article for the Royal Society by Jon Agar here.)
Margaret Thatcher much prided herself on being the only scientist in her government. Anything that related to science she took a particular interest in, and almost felt that she owned it. Some of her views were radical and didn’t always fit the other views she heard from others. The main advice she got was, of course, from the civil service machine. I came back from New York to attend two meetings for her. I think she regarded me as someone useful who could stir the pot for her, and perhaps challenge the orthodox wisdom, whatever it might be.
Part of Tickell’s remit was to float various policy ideas that may be of interest to Thatcher and support her political profile. Out of such a pitch came the genesis of the grounding-breaking speech given by Thatcher at the Royal Society.
She was more receptive on some things than on others. The genesis of the 1988 speech to the Royal Society on climate change arose from a meeting when I went to see her when I was on holiday. I always tried to make a point of going into No.10 when I was on holiday. I then suggested three ideas to her which she might try. I didn’t know which, if any, of them she was going to follow. Then I heard about three weeks later that she was interested in the one about climate change, and we started toing and froing about what she might say and when she might say it. She’s always been very interested in science and felt that she had that particular contribution to make.
The speech (transcript can be found here) was ground-breaking in that is was the first in which a world leader had called attention to the threat posed by greenhouse gas emissions:
For generations, we have assumed that the efforts of mankind would leave the fundamental equilibrium of the world’s systems and atmosphere stable. But it is possible that with all these enormous changes (population, agricultural, use of fossil fuels) concentrated into such a short period of time, we have unwittingly begun a massive experiment with the system of this planet itself.
Recently three changes in atmospheric chemistry have become familiar subjects of concern. The first is the increase in the greenhouse gases—carbon dioxide, methane, and chlorofluorocarbons—which has led some[fo 4] to fear that we are creating a global heat trap which could lead to climatic instability. We are told that a warming effect of 1°C per decade would greatly exceed the capacity of our natural habitat to cope. Such warming could cause accelerated melting of glacial ice and a consequent increase in the sea level of several feet over the next century.
Spencer Weart, a leading scholar on the history of climate change and author of the modern classic “The Discovery of Global Warming” credits Thatcher as being the first world leader to call for the mitigation of green house gas emissions (here). Her unequivocal position can be seen in this address she gave to the United Nations General Assembly in November 1989 (here).
But the problem of global climate change is one that affects us all and action will only be effective if it is taken at the international level.
It is no good squabbling over who is responsible or who should pay. Whole areas of our planet could be subject to drought and starvation if the pattern of rains and monsoons were to change as a result of the destruction of forests and the accumulation of greenhouse gases.
We have to look forward not backward and we shall only succeed in dealing with the problems through a vast international, co-operative effort.
A second key shaper of Thatcher’s view on climate change was John Houghton. Houghton had been Chief Executive of the United Kingdom Meteorological Office from 1983 and also a senior figure on the World Meteorological Office (WMO). The Intergovernmental Panel on Climate Change (IPCC) was, in fact, born out of the WMO. Houghton worked well with Thatcher as can be seen in this interview Houghton gave for the WMO here.
However, back in 1990 I had one very good ally and that was Margaret Thatcher. She gave a talk to the Royal Society in 1988 and – remember she was a scientist by background – she talked about global warming and the newspapers carried this as their headline the following day. That was the first time, in the UK at least, that global warming started to appear on the ‘map’.
Earlier in 1988, the Canadians put on their own global warming conference which raised political awareness in a very important way. 1988 was also the time when the Intergovernmental Panel on Climate Change had its first meeting and I was asked to be the chairman of its Science Assessment Panel. We had long debates, with hundreds of scientists worldwide, and we had a very interesting time determining what was happening on a global scale and what we could predict for the future.
In 1990 we had our final meeting in Windsor of this scientific group, agreeing the conclusions that would be put forward by the IPCC. Because the IPCC is an Intergovernmental Body, governments now started to take ownership of the assessments and many were accepting the findings. I subsequently presented the findings to the Thatcher Cabinet at Downing Street. It was the first time they’d ever used a projector in the Cabinet Room and famously Margaret Thatcher listened for twenty minutes without interrupting – an unusual occurrence apparently!
The scientific and political concensus that resulted meant that the 1992 Earth Summit in Rio de Janeiro saw all the nations of the world sign the framework convention on climate change. This included the USA and President Bush I.
Houghton’s good relationship with Thatcher paid dividends in the establishment of the Hadley Centre for Climate Prediction and Research in 1990, an organisation which was supported jointly by both the Met. Offfice and the Department of the Environment and kept the U.K at the forefront of climate research. But on 22 November 1990 Thatcher quit the premiership after losing the support of her colleagues, and from that time on she contributed little to the climate change debate until the publication of her book Statecraft in 2002.
The book contained a chapter called “Hot Air and Global Warming” that could have been written by any true-believing climate skeptic. Moreover, as a result of this book, such high profile skeptics as Anthony Watts and Christopher Booker came to laud Thatcher as one of their own (for example here). Given that most of her information sources for the chapter came from libertarian think tanks such as the Heritage Foundation, the Cato Institute and the Reason Foundation (all of which she references), this is not really surprising.
Further, in the process of becoming a skeptic, Thatcher now viewed the IPCC as ‘alarmist’ and climate change science as a stalking horse for international socialism. From the book:
The new dogma about climate change has swept through the left-of-centre governing classes
And
provides a marvellous excuse for worldwide, supra-national socialism.
The switch was a triumph for the right-wing think tanks and other assorted merchants of doubt. Yet this outcome is certainly not a triumph for humanity, and nor, in reality, for the political right. Climate change will grind forward regardless of the pronouncements of the left and right. To pretend it doesn’t exist as part of a policy platform is stupid in the extreme. Many political pronouncements can never be refuted as they are normative statements—a question of personal ethics or beliefs. Climate change is not one of them: it will get hotter or it won’t. Someone has to be wrong.
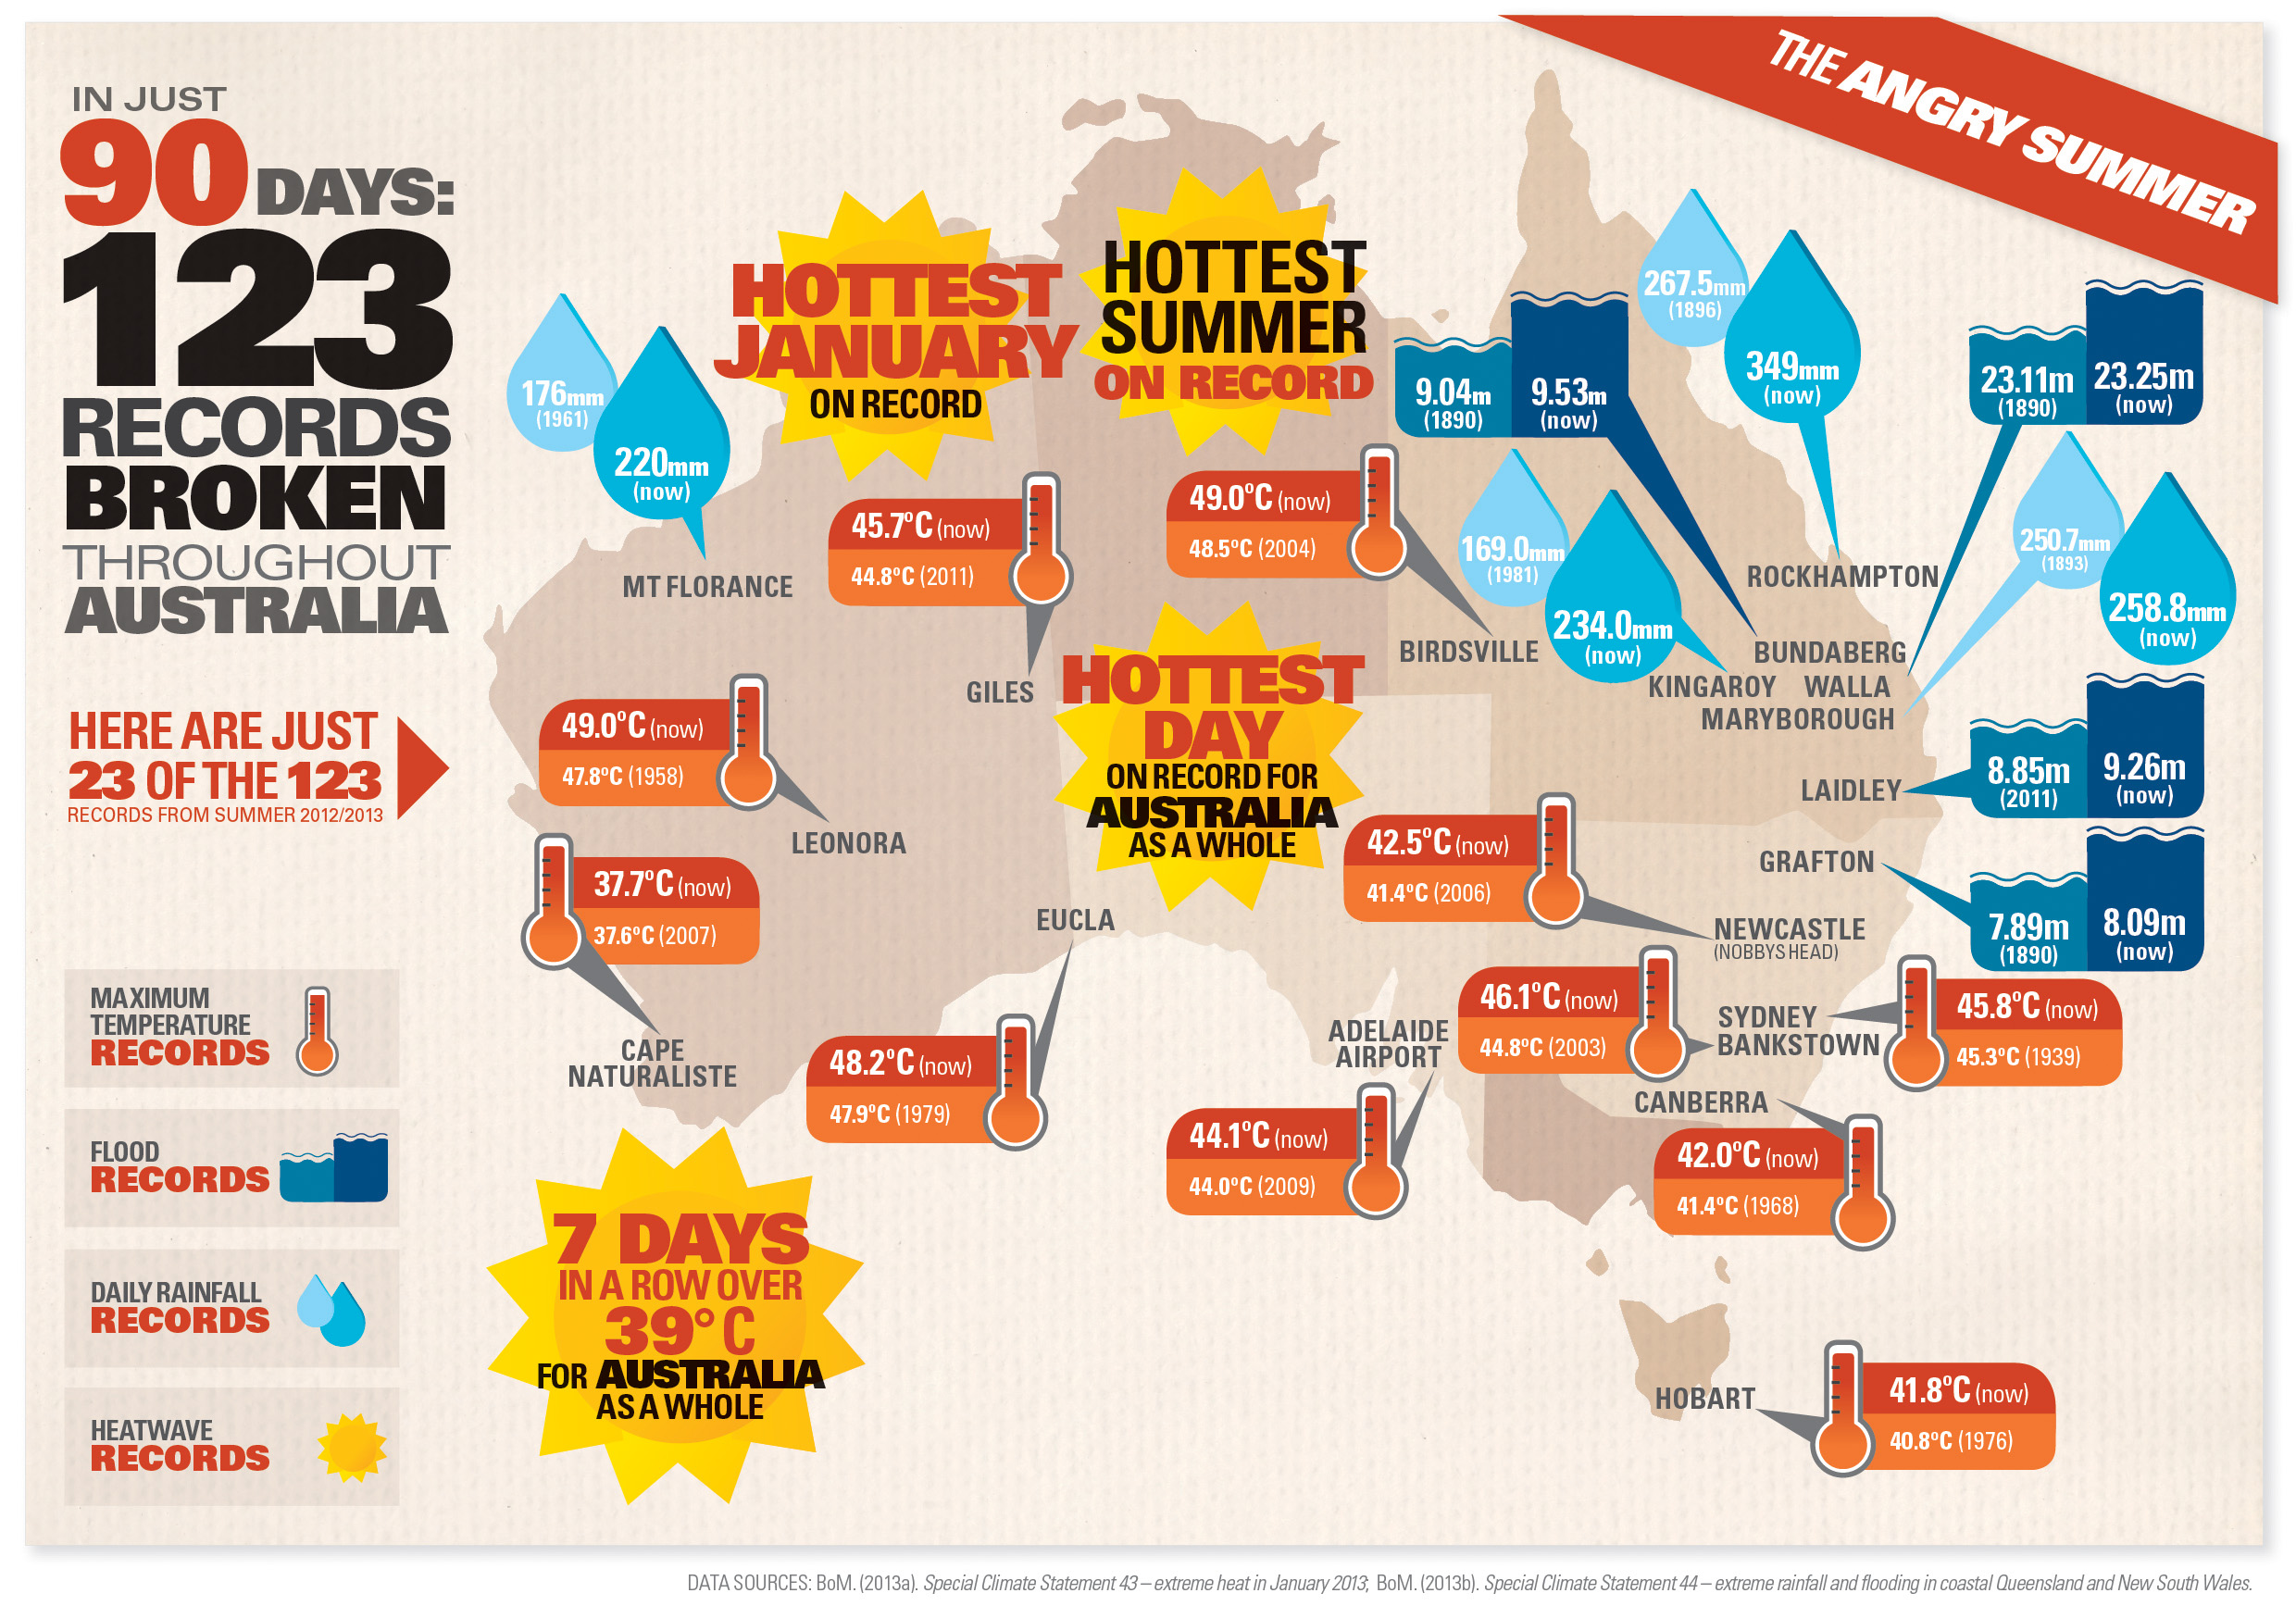
The Climate Commission of Australia has done some wonderful work highlighting the extraordinary nature of last summer’s weather within the context of climate change. The full report, called the Angry Summer, contains some great graphics such as this (click for larger image):
And this:
And for flooding, this:
And a shifting probability distribution showing the change in risk:
The report is authored by Professor Will Steffen, who has been very active in climate change communication. He has been associated with popularising the idea of the ‘anthropocene’, a new geological time period within which climate is driven by man, and the concept of multiple planetary boundaries:
I have huge respect for climate scientists who step out of their narrow academic silos in order to engage with the general public and influence the policy debate. For a flavour of the man, see this Ted Talk here:
The Economist magazine last week carried a long article on climate sensitivity together with a leader article on the same theme here. Skeptical Science’s Dana Nuccitelli posted a rebuttal here, which captures some of my own concerns over The Economist‘s interpretation of the science. It is obvious, however, that Nuccitelli has never read The Economist, since he characterises the magazine as having strayed into the field of climate change commentary almost by accident. This is ridiculous: The Economisthas been doing in-depth reporting on climate change issues for many years and has been far more consistent in its coverage than either The Wall Street Journal or The Financial Times. Moreover, The Economist does matter since it has become the house journal of the global corporate, financial and political elite. Indeed, The Economist‘s coverage of climate change deserves a post all of its own (I am working on one).
If I was rather ambivalent on Skeptical Science’s treatment of The Economist, they quickly redeemed themselves with a wonderful post on the history of climate change science. The definitive book on this topic is Spencer Weart’s The Discovery of Global Warming, but John Mason has produced a great condensed version of the history including some wonderful timeline graphics.
Professor James Hamilton, one of the world’s top econometricians, is a rare example of an economist who understands the threat posed by oil depletion. In this post on his blog Econbrowser, he evaluates the oil supply and price prediction record (from 2005) of the cornucopians, as represented by Daniel Yergin, and the peak oilers, as represented by Boone Pickens. The conclusion? Pickens won hands down.
If you are curious about alternative views on economics, then I recommend having a look at such ecological economists as Herman Daly. Jushua Farley, the co-author with Daly of the iconic textbook Ecological Economics, explains the difference between ecological economics and traditional neoclassical economics here. Farley’s main complaints are with the obsessive quest for economic growth in traditional economics and the inability of neoclassical economics to accept the empirical evidence before their eyes; for example, markets are not taking us toward a stable equilibrium.
If you want to understand what could possibly be driving the weird weather in northern European and beyond then read this article by the leading climate scientist Stefan Rahmstorf via Eli Rabett. You reap what you sow.