
For those interested in climate change and energy issues, the 2009 book “Sustainable Energy – Without the Hot Air” by Cambridge University Professor David MacKay published in 2009 was a revelation (made freely available online as well, and still there). MacKay provided a rigorous but accessible analysis of what it would take to wean the world off fossil fuels.
MacKay was no emotional ‘eco-warrior’ calling the faithful to arms, yet still a strong supporter of renewables. But every renewable or clean energy pathway explored in the book is deconstructed to check the validity of the underlying physics and maths. The book will have you recalling your high school science lessons, but in a fun and entertaining way. Despite it now being 10 years old, I still think “Without the Hot Air” remains a vital desk reference for anyone interested in climate and energy issues.
Tragically, MacKay died of stomach cancer at the far-too-early age of 48. The loss was even more telling as beyond his successful career in academia and his outreach into popular science, MacKay’s influence had extended into public policy sphere, resulting in him being appointed Chief Scientific Advisor to the UK Department of Energy and Climate Change in 2009.
To get an idea of MacKay’s approach to renewables, it is worth listening to his 2014 Ted Talk here. In his words: “I’m absolutely not anti-renewables. I love renewables. But I’m also pro-arithmetic”
With MacKay as my guide, we are now ready to interrogate Seba’s analysis. First thing is to choose our energy unit of measurement. As usual, the flagship energy statistics publications have their favourites, which differ. The International Energy Agency likes to use Mtoe (million tonnes of oil equivalent) while elsewhere we can find Mboe (million barrels of oil equivalent) and MBtu (million British thermal units). Throughout my blog posts on the electric vehicle revolution I focussed on kWh (kilowatt hours). Since MacKay also likes kilowatt hours, this makes life a bit easier. From Mackay’s TedTalk we also learn that the UK consumes an average of 125 kWh of energy per person a day (electricity, heat, transport, etc) and the USA about twice that at 250 kWh per person per day.
To help his audience get an intuitive grasp of what that amount of energy relates to he uses the image of a collection of light bulbs. Unusually, for MacKay, I didn’t think that was a great example since lightbulbs come in all sorts of energy efficiencies these days. But by doing a bit of basic maths backwards, it seems he is talking about 40 watt ones. So the maths goes like this: 40W equals 0.04kW. So if you leave it on for an hour, that’s 0.04kWh and multiply by 24 as its on all day or 0.96 kWh, so basically 1kWh. So 125kWh is equivalent to leaving 125 40W lightbulbs on all day.
Let’s fact check one of those numbers against primary sources just to make sure the daily numbers are in the right ball park. The International Energy Agency (IEA)‘s publication “Key World Energy Statistics 2018” is one of the most authoritative sources of information in the energy field. On page 34, we find that total primary energy supply (TPES) in the United States in 2016 (latest data) was 6.7 tonnes of oil equivalent per person. That is for the entire year, so we need to change it into kWh and then make it per day. One tonne of oil equivalent is equal to 11,630 kWh (using the conversion tables in the same publication) or 31.9 kWh per day. Multiply, that by 6.7 and we get 213 kWh. That looks a little short, but then we need to adjust for the fact that, despite the fracking revolution, the USA is still a net importer of energy: around 10% is imported (see here). After this correction, we get 237 kWh per day. I think that is sufficiently close to 250 kWh to get a fact check seal of approval.
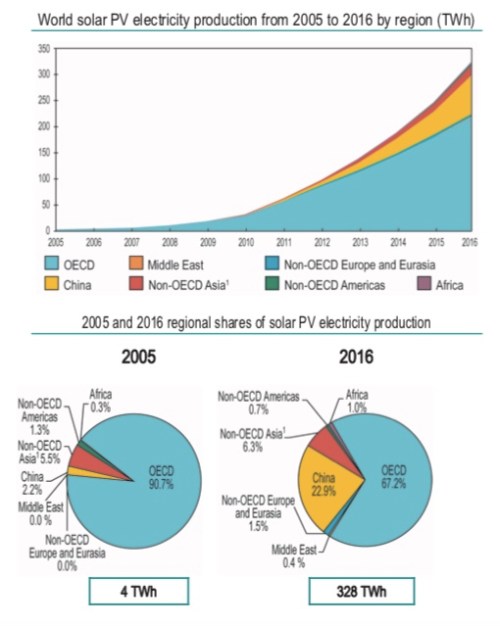
Now let’s fact check one of Tony Seba’s number using the same IEA report. As referenced in my last post, Tony has existing solar at 1.5% of global total energy production. The IEA report has global photovoltaic energy production at 328 terawatt hours in 2016.
The same report also gives total primary energy supply (TPES) at 13,761 million tonnes of oil equivalent. Note that the Other category at 1.7% includes not only solar but also wind, tidal and so on. So does solar dominate ‘Other renewables’?
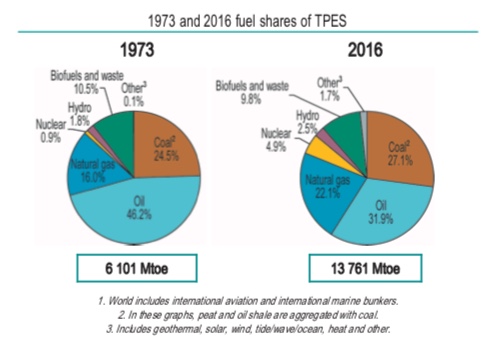
To answer that question, first let’s check what 13,761 Mtoe in terawatt hours? Again from the IEA‘s conversion charts we get 1 Mtoe equal to 11.63 terawatt hours (TWh). Just as a gentle reminder we go watt, to kilowatt, to megawatt, to gigawatt, to terawatt, with each step change rising by a factor of 1,000.
Accordingly, 13,761 Mtoe equals roughly 160,000 TWh) (for a useful online unit converter see here). Divide that by 328 TWh gives us 0.2%! After this calculation, I decided I needed to fact check my fact checking, so I went away to find different sources. The renewables industry has its own multinational body called the International Renewable Energy Agency (IRENA). They put out at statistical yearbook (here). From this we get a much more detailed statistical breakdown of the solar industry. But IRENA‘s numbers line up with the IEA. In 2016 according to IRENA, total solar energy production was 329 TWh split between 318 TWh as solar photovoltaic and 11 TWh as concentrated solar.
So Tony’s number for solar within global energy production appear to be out by a factor of five or more. So what could account for this? Some possible mistakes could be:
- Confusing solar capacity with solar production
- Mixing up electricity production with total energy production
- Getting the conversion units wrong; for example, converting millions barrels (Mboe) of oil equivalent into terawatts instead of million tonnes of oil equivalent (Mtoe)
- Using the overall non-hydro renewables number rather than that just for solar
All of the above would appear highly unlikely given Seba lives and breathes transport and energy economics. So if anyone has any ideas how one can get solar energy production to be 1.5% of the total I would love to hear from you.
At this point you may be wondering whether this is the end of this series of posts. If we are starting at 0.2% solar penetration of total energy production there is no way we will get anywhere near 100% in 2030. True, but if we take Seba’s two-year doubling metric, it only takes 8 years to go from 0.2% to 1.6% so his forecasts are only pushed out to 2038. That is still far more aggressive than any other forecast – and is still world changing. Plus wind power is going to do a significant portion of the heavy lifting in any energy transformation, a renewable source Tony strangely ignores.
And at the heart of Tony’s thesis is a truth: if costs compound down at an exponential rate, then penetration could compound up at an exponential rate. Interestingly, as I dipped back into my well-worn copy of MacKay’s “Sustainable Energy Without the Hot Air” there were certain instances where Tony’s simplistic analysis has been right and MacKay backed the wrong horse.
Before I wrap this post I also want to extract another number from the data we have: average energy production per person across the entire globe. In 2016, the world’s population stood at 7,466 million. From the IEA report above, we also know that energy production in 2016 was 160,000 TWh. Divide one by the other and we get 21,430 kWh. Divide that by 365 and we get 59 kWh per person per day.
With those numbers tucked under our belt, we are ready to look at land mass issues: a subject central to David MacKay’s analysis but one that barely features in Tony Seba’s.


I don’t suppose he used BP’s Statistical Review data for his figure of solar generation? They do a funny thing to their renewables numbers to make them comparable with everything else (I think it’s a crazy thing to do and just confuses people):
“The primary energy values of nuclear and hydroelectric power generation, as well as electricity from renewable sources, have been derived by calculating the equivalent amount of fossil fuel required to generate the same volume of electricity in a thermal power station, assuming a conversion
efficiency of 38% (the average for OECD thermal power generation).”
https://www.bp.com/en/global/corporate/energy-economics/statistical-review-of-world-energy/using-the-review/methodology.html
It wouldn’t account for all of the variance but might account for a chunk of it.
Jamie. Yup that would bump them up if you multiplied them by 2.5 times to get a fossil fuel equivalent.
Like you, I am a fan of David MacKay, and reading his book to a certain extent changed my life, however I have come to believe that there is something to the criticisms that he presented the renewables issue in such a way as to discourage their uptake. In the video, have a look the way he presents transport options at 13:09 and tell me if you think it is a fair presentation of EVs. In his final interview on his deathbed, MacKay said, “Until now I haven’t really showed my hand. There’s only one solution and its nuclear and CSS.”
On solar, I think you are right and Seba has made an error. Solar was 1.8% of global electricity in 2017, there was another 27% growth in 2018 so we could be up to 2.3% by now which would be about 0.5% of global final energy consumption.
The reason Seba and others often focus on solar instead of wind is that if you are looking for long-term solutions, there is far more solar available, and it is likely that eventually it will be cheaper as well.
Robert: This is going to pre-empt future posts, but I think what David MacKay got wrong was his experience curve economics. In the post I’m writing I’ll pick out the actual quotes, but basically MacKay believed solar PV just couldn’t get cheap enough. It’s interesting that in Seba’s book Solar Trillions that came out in 2010 shortly after MacKay’s “Without the Hot Air” Seba expected solar to hit 3.5 cents per kWh in 2020. We flew past that already in 2018, so a big score for Seba. MacKay’s scepticism over how much of the heavy lifting solar could do, and the need for nuclear to be part of the decarbonisation mix, really stems from his pessimism over the experience curve and the cost trajectory of solar. A lot more to come on this
Professor Seba reasons from a different base of evidence than the above, and even a different one than the IEA or U.S. EIA. Accordingly, it is not surprising his projections differ from theirs or yours. I’m not saying he is necessarily correct as a result, but, on the other hand, I think it only fair to point out this apples and oranges difference.
In particular, Professor Seba — and he always points this out at the start of all his talks — is using disruptive technology experience to project what will happen with this new technology of wind, solar, and storage. He’s not doing energy accounting. He’s using past quantitative experience with diffusion of innovations to track, forecast and project. These are well-established logistic curves, primarily produced by the Bass diffusion model and its improvements. This is like predicting observables of physical systems by knowing their Lagrangian or Hamiltonian instead of modeling them bit by bit. It’s uniformly more powerful, and sweeps aside a lot of detail. I would say that someone who relies upon IEA or U.S. EIA to dispute these, including the late Professor MacKay, needs to explain why Bass won’t dominate these areas. Wind, solar, and storage are new technologies, not really directly comparable to natural gas (say), because they have zero marginal cost. That’s the core of Seba’s argument, that the future is more along the lines of computers or digital cameras or smartphones, not more pipes and fluid. He’s not the only one: This is the essence of Marc Andreeson’s “Software is eating the world“.
To Professor Seba’s additional credit, whether it is the IEA, or the U.S. EIA, or even the very conservative ISO-NE which operates the grids I am most familiar, in New England, each one of them, because they rely upon projections of historical data, have repeatedly missed built-outs of solar and wind energy which, after all, are basically the same — powered by the Sun. The difference is, of course, that wind can be available when the Sun doesn’t shine. (And, to counter the familiar saw, even if it has exceptions, solar availability and wind generation tend to be anti-correlated, especially at sea.)
These projections — and yours — ignore others which are also hardly emotional eco-warriors. I principally use Lazard’s LCoE and Lazard’s LCoS. Now, it is true markets may be inefficient, and there may be lags in rollout. But should these learning curves continue, even if utilities don’t get with it — and there’s a lot of evidence they are, even my local ISO-NE — it is going to be difficult for large commercial consumers of electrical energy, such as manufacturers, to ignore the competitive pricing from these sources, as well as the incredibly attractive constant cost per year for 20-30 years, something no natural gas source can do. Should that happen, then the political and economic pressure on regulators to permit commercial distributed generation — small grids, if you will — will eventually be overwhelming.
Also, again to Professor Seba’s credit, learning curves appear to be ignored by many policymakers in the energy area. Considering them explains, for example, the loss of appetite for nuclear energy, which has exhibited negative learning curves anywhere it has been developed. Studies of these show this is not because of the usual suspicions of regulation and opposition, but, rather, because nuclear power developers chose early on to parlay their improved knowledge of doing nuclear plants into bigger and bigger proposals for power — for reasons which might have something to do with the cost-plus nature of these contracts — rather than turning nuclear reactors into relatively small, modular, per-copy cheaper units which could be strung together to achieve arbitrary power sizes yet retain the reliability which only redundancy offers. Had that been done, the commodity learning curve phenomenon would have been available to the industry.
It’s also necessary to be careful about IEA and EIA numbers: Many of theirs do not include private residential PV generation, because those numbers are, in some jurisdictions, not available. These have taken Massachusetts by surprise, since the overwhelming amount of PV generation here comes from residential, not solar farms.
ecoquant. This series of posts has barely begun and I am far away from making any projections of my own. The only statistic I would pull him up for so far is a backward-looking one, not a projection; that is, the current contribution of solar to total final energy demand. His 1.5% number looks way too high from any perspective. Nonetheless, and as I alluded to in my last post, there are areas where I already feel Seba has been right and MacKay has been wrong (although whether that is enough to get us to 100% solar is an entirely different matter). If you read my series of posts on EVs you will see I am very sympathetic to Seba’s model of disruptive change, but I think 100% solar by 2030 looks a far, far more difficult goal than, say 95% sales penetration of EVs by 2030. But all this is to be discussed and I may change my mind as I work through these posts.
https://en.wikipedia.org/wiki/World_energy_consumption
They quote BP for their 1.3% number (link to BP results in error page), so part would be the conversion factor. But, solar is not the same as PV. There is also solar hot water heating
Click to access SHC%20Market%20and%20Industry%20Trends_WWeiss.pdf
which comes in at 388 TWh for 2017 according to this source.
Now convert the 460 TWh solar PV using a conversion factor of 2.5
https://www.iea.org/topics/renewables/solar/
and we have about 1500 TWh, still a little short of 1.3%, but not by that much.