On November 27th, the U.S. government agency The Energy Information Administration (EIA) announced provisional U.S. crude oil production figures for September 2013. Key points:
- September crude oil production was 233.8 million barrels, equivalent to 7.8 million barrels per day (bpd)
- Change over September 2012 on a barrel-per-day basis: +18.6% y/y
- September total crude oil plus natural gas liquids reached 315.0 million barrels, equivalent to 10.5 bpd
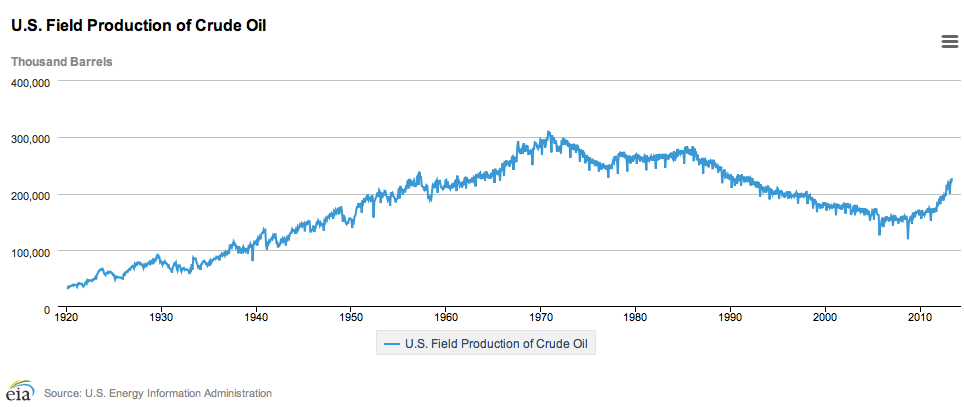
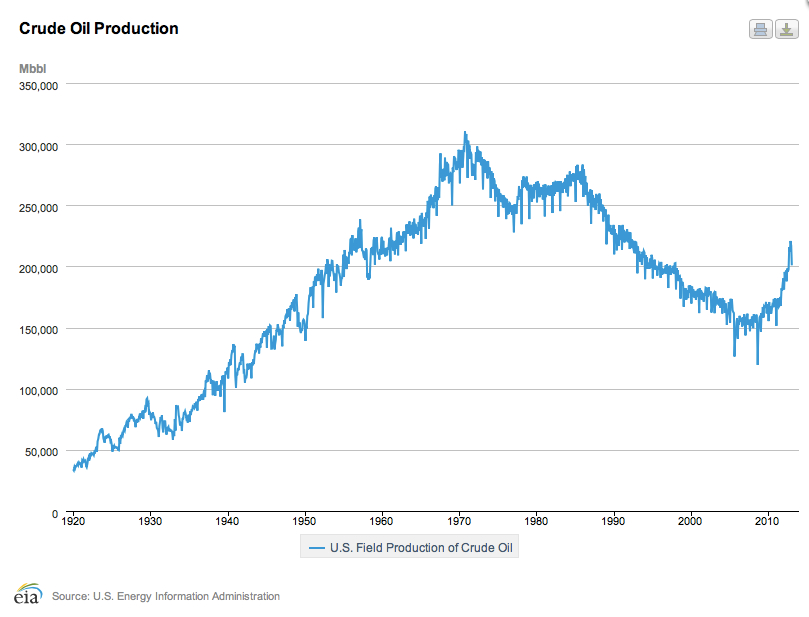
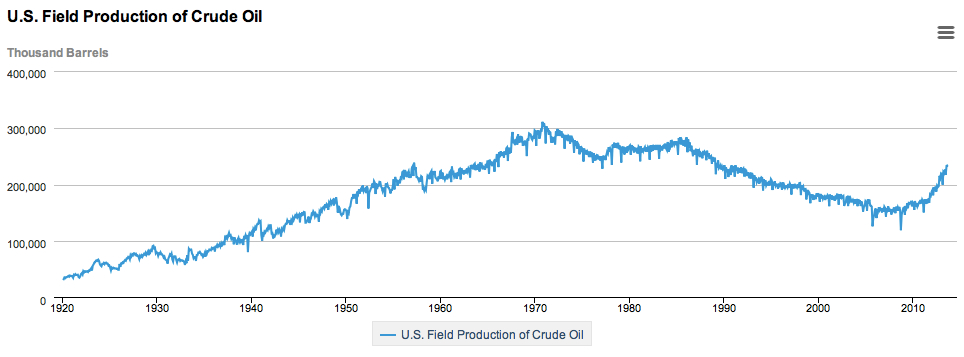
As can be seen from the chart below (click for larger image, link to original data here), the fracking of tight oil formations in the U.S. has made a major impact on U.S. crude production over the last few years. The critical question is whether the current large year-on-year percentage growth rates in oil production can be sustained. On the current trajectory, the US is set see production pass its peak of the 1970s.
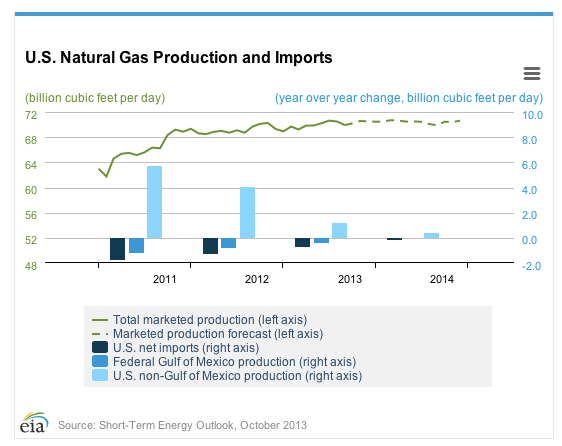
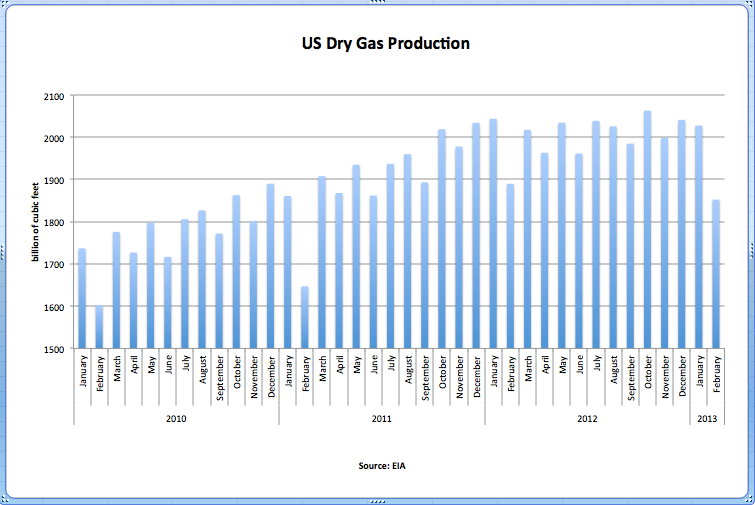
Growth rates for both crude oil production by itself and crude plus natural gas liquids remain robust, continuing to track in the high teens. The situation for oil is in marked contrast to that of U.S. natural gas, where production growth has stopped.
The differentiator here is price. Both tight gas and tight oil are expensive to produce compared with the conventional alternatives. Accordingly, production investment requires a high product price to remain feasible. U.S. natural gas prices are down roughly by half from their average level in the 2005 to 2008 period (removing the temporary 2008 spike). By contrast, the price of West Texas Intermediate, the U.S. benchmark oil price, remains near all-time highs (again excluding the very short-term 2008 spike).
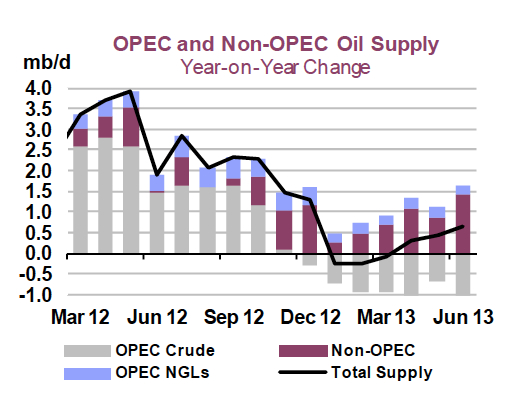
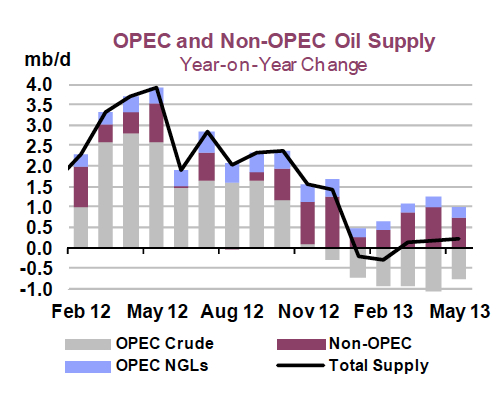
Given crude oil is a globally traded commodity, U.S. production numbers need to be placed in the context of world supply and demand. In its latest Oil Market Report dated 14 November 2013, the International Energy Agency (IEA) recorded global ‘all liquids’ production of 91.8 million bpd for October 2013.

Full quarterly IEA world supply-and-demand figures, including Q3 2013 supply estimates, can be found here.
Prices have eased in recent weeks after the threat of a military strike against Syria was removed. Moreover, the detente between the US and Iran has also opened up the prospect of more Iranian crude coming on to global markets in 2014.