Tag Archives: EIA

The EIA Sees Our Energy Future – Which Doesn’t Look That Much Different from Today

Exams finished (I’ve been exercising my brain cells by doing some data analysis and computer courses with the UK’s Open University), so I have at last had a chance to blog.

Let’s kick off with a report I usually try to catch each year: the US government’s Energy Information Administration (EIA)‘s “Annual Energy Outlook 2015“, which looks out to 2040.

If you keep up with media reports, the backdrop to the 2015 Outlook would be something like this:

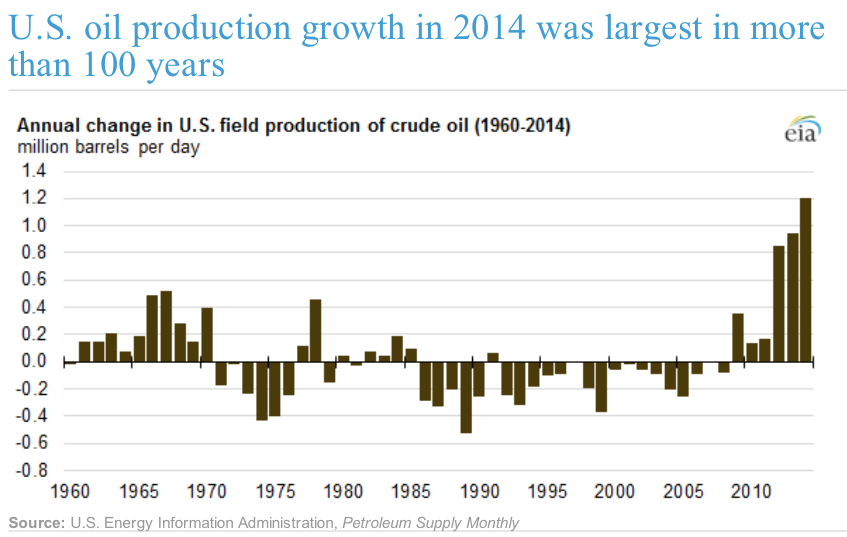
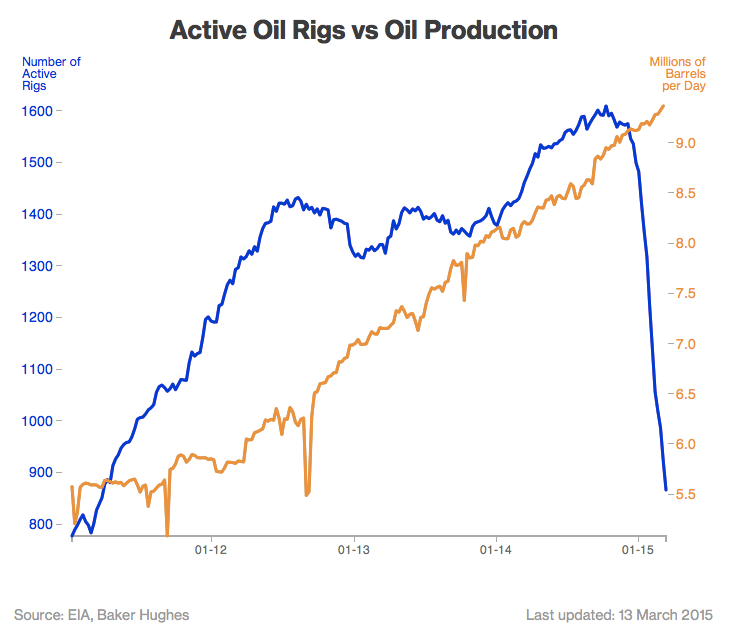
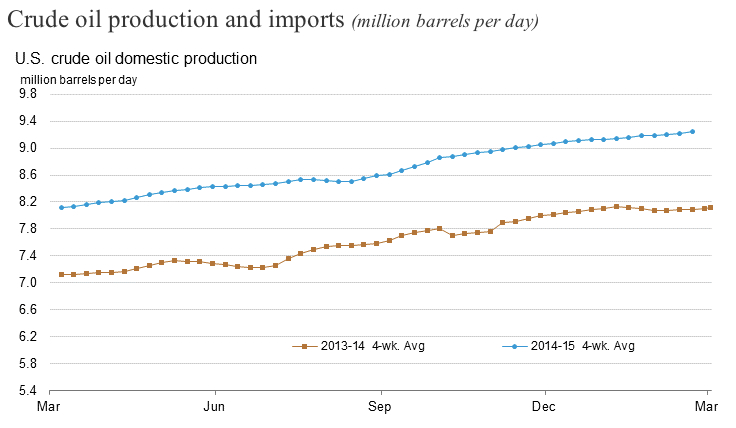
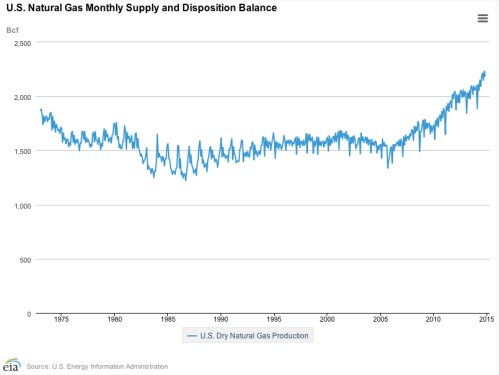
US oil production has pushed up toward 10 million barrels per day (bpd) and is a whisker away from overtaking Saudi Arabia; five LNG export terminals have been approved and are under construction because the US is so awash with natural gas (due to the fracking boom) that it needs to export it; solar PV panel price falls coupled with efficiency gains have brought the levelised cost of solar PV down so substantially that solar energy is now making a major contribution to electricity generation in an ever-growing number of American states; Texas has become a wind-energy king second only to Denmark; and Elon Musk is bringing power to the people (literally) in the form of a new generation of home super batteries.

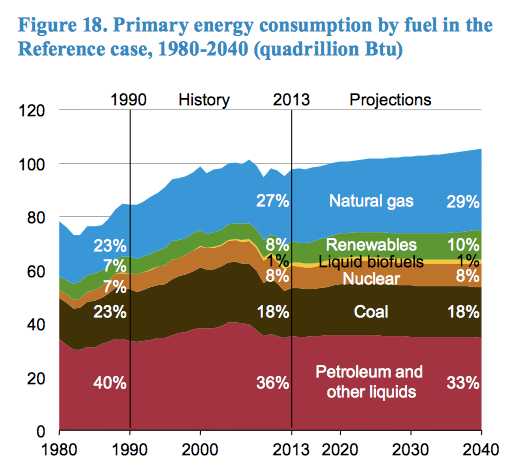
Wow, sexy stuff! So I guess we are going to see the EIA predicting radical changes to the energy mix in 2040, especially as many of the trends I just highlighted are only getting started. Right? Let’s look at EIA’s flagship chart (page 17 of the report, click for larger image on all charts):

US Primary Energy Consumption jpeg

Continue reading

Charts du Jour, 6 April 2015: US Natural Gas Production

The US government agency The Energy Information Administration reported natural gas production numbers for January 2015 on 31 March (numbers are reported with a two month lag).

US dry gas production was up 8.9% year on year in January, and the 12-month moving average was 6.1% higher year on year, the highest growth since October 2012 (click for large image; source: here).

US Dry Gas Production Jan 2015 jpeg

Meanwhile, natural gas prices have continued to trend down and are now reaching around $2.5 per million British thermal units (Btu). This is not far off their 2012 lows (source: here).

Henry Hub Prices Mar 15 jpeg

Continue reading

US Crude Oil Production for January 2015 (and Calling the Top)

Time for a switch in focus, from the philosophical yesterday to the prosaic today. It’s that time of the month for some hard numbers from “frack land”, i.e., the good old USA. What is more, I am going to stick my neck out today and call the top for US crude oil production.

The US government agency the Energy Information Administration (EIA) reports monthly crude oil production with a 2 month lag; January 2015 data were published on 30 March. January saw oil production averaging 9.2 million barrels per day, a rise of 14.8% year on year. Over the previous month, production was down slightly. Nonetheless, we did see a month-on-month decline in November only for production to power to a new record again in December.Yet I’m still calling the top.

True, growth has far exceeded what I expected when I started writing this blog. The production surge is indisputable (here, click for larger image).

US Oil Production jpeg

The reason why I didn’t expect to see output rise so far so fast was due to the high production declines rates exhibited by tight oil plays, leading to what many call the ‘Red Queen’ syndrome: the need to run faster and faster just to stand still. So a mea culpa on my side: the US shale oil industry did run faster and faster. With global crude oil prices locked above $100 barrel for three long years, we got both a lot more rigs and, critically, more efficient rigs as fracking technology advanced. This was enough to overwhelm the naturally high depletion rates. Continue reading

Charts du Jour, 17 March 2015: Pump Baby Pump (but Don’t Drill)

I regularly report on the Energy Information Administration‘s monthly US oil production statistics, which show no slowdown in output as yet (see here for latest numbers). Bloomberg, however, has a series of multimedia offerings giving more colour as to what is going on.

First, a nice chart juxtaposing production and rig count numbers (source: here).

Active Oil Rigs jpeg

And for a great animated graphic showing rig count through time and space, this offering (again from Bloomberg) is superb. Below is my screen shot, but to get the full effect click this link here.

Watch Four Years jpeg

Finally, an animation explaining why the crashing rig count has yet to stop production rising. In Bloomberg‘s view, the divergence between rig count and production has many months to run.

National Geographic recently had an article titled “How Long Can the US Oil Boom Last?” which emphasises the longer view. They argue that the US fracking boom is a multi-year phenomenon not a multi-decade one.

But in the long term, the U.S. oil boom faces an even more serious constraint: Though daily production now rivals Saudi Arabia’s, it’s coming from underground reserves that are a small fraction of the ones in the Middle East.

Both the EIA and the International Energy Agency see US oil production peaking out by the end of the decade regardless of short-term oil price fluctuations. Nonetheless, both organisations have underestimated the upswing in tight oil production to date. Overall, it is very difficult to gauge where US production will be in five years time. This is a bigger story than the current spectacular rig count crash, and one I intend to return to in future posts.

Chart of the Day, 1 March 2015: US Crude Oil Production for December 2014

Yesterday, I noted that US natural gas production has yet to reflect the recent prices declines. Today, I am reporting basically the same story for crude oil.

The US government agency the Energy Information Administration (EIA) reports monthly crude oil production with a 2 month lag; December production was published on 27 February. December saw oil production averaging 9.2 million barrels per day, a rise of 17.4% year on year. The two following charts are taken from the EIA’s weekly oil report here (click for larger images).

US Crude Oil Production  jpeg

The chart of futures prices below shows the 50% decline between the summer of 2014 and the beginning of 2015.

US Crude Oil Futures Prices jpeg

As discussed in my post at the beginning of February, it will take another six to 12 months before futures hedges roll off and rapid shale field depletion rates mean that additional capital investment is required in order to sustain production levels. Such investment will only be forthcoming if the new oil price environment is countered by further technology driven cost savings.

My sense is that new investment projects won’t hit their required hurdle rates and so won’t go through. If so, production will first plateau and then fall. As always, we have to let the data speak on this one.

Chart of the Day, 2 Feb 2015: Still Talking about a Shale Gas Revolution?

The US government’s Energy Information Administration (EIA) has just come out with US natural gas production figures for November. But before we look at them, let’s glance at the long-term chart first (Source EIA here):

US Natural Gas Monthly Supply jpeg

Looks good if you are a fracking enthusiast, although the chart makes the shale gas surge seem like one continuous, seamless event. Scale up to the monthly chart and the situation looks a bit more nuanced:

US Dry Gas Production Nov 14 jpeg

For two years, 2012 and 2013, production almost flatlined, before jumping up again at the beginning of 2014. The latest numbers show dry gas production for November up 6.2% year on year, and the twelve month average rose 4.6%. What explains the two-year hiatus in the shale gas revolution? That’s easy: price (Source: Nasdaq).

Natural Gas Futures jpeg

The Holy Grail for shale gas enthusiasts is rising production and cheaper prices. In reality, however, what we have seen is rising production when prices are high, but stagnating production when prices fall. We haven’t really seen the same dynamic for tight oil in the US because we haven’t seen a prolonged period of falling prices–until now.

Meanwhile, the EIA’s latest Short-Term Energy Outlook (STEO) , released on 13th January, contains new forecasts that extend out through 2016 . The outlook is for a short plateau, then a renewed upward move:

STEO Jan 15 copyTo be honest, foresting oil and gas markets is a nightmare, the reason being that you are actually having to forecast two interlocking variables: price and production. Keeping that caveat in mind, here is the EIA’s price forecast:

Henry Hub Natural Gas Prices

The chart is a little difficult to read, but the EIA is looking at $3.44 per million Btu in 2015 and $3.86 in 2016. This compares with an average of $4.39 in 2014.

Putting price and production together paints a pretty optimistic picture from the EIA. Previously, the slump in prices in 2011 led to a plateauing of production in 2012. Further, a jump in prices in 2013 resulted in reinvigorated production growth in 2014. Of course, technology is changing, and this relationship may not hold. Indeed, that is what the EIA argues (from the 13th January STEO, click for larger image):

STEO Gas Production Commentary jpeg

There are a lot of moving parts to the story. I haven’t touched upon the implications for associated natural gas (gas produced as a byproduct of drilling for tight oil) stemming from the oil price slump. Nor have I dealt with the big spat between the journal Nature and the EIA over shale gas reserve calculations. More to come on both of these topics in future posts.

Overall, though, remember the “peak oil” theory is really one of peak cheap oil (see my posts here and here). and you can extend the same logic to gas. Consequently, the cornucopians have a golden opportunity to nail the peakists if they can show one thing: that the world can produce more oil and gas at the current low oil and gas prices. We have a testable hypothesis–let’s see what happens.

Data Watch: US Natural Gas Monthly Production February 2014

The US government agency the Energy Information Administration (EIA) issues data on U.S. natural gas production, including shale gas, on a monthly basis with a lag of roughly two months. The latest data release was made on April 30th, and covers the period up until end-February 2014. Data is reported in billion cubic feet (bcf) and can be found here. Key points:

  • February 2014 natural gas dry production: 1,896 bcf, plus 2.8% year-on-year
  • Average monthly production for the 12 months to February 2014: 2,034 bcf, +1.7% over the same period the previous year
  • Since the end of 2011, production growth has stalled (click chart below for larger image), with the year-on-year 12-month average bumping along a plateau.

U.S. Dry Gas Production Feb 14 jpeg

There was significant natural gas price volatility over the winter period due to unusually high gas demand prompted by periods of extreme cold. Critically, however, natural gas prices have remained elevated into spring at around $5 per million British thermal unit (Btu).

Natural Gas Spot Price May 14 jpeg

To put the current price of $5 in perspective, a long-term chart of natural gas prices is given below (click for larger image). Note that 1 million Btu is roughly equivalent to 1,000 cubic feet; the unit price is, therefore, comparable even though one chart refers to Btu and the other cubic feet.

U.S. Natural Gas Well Head Price April 2014 jpeg

As can be seen in the chart, two natural gas spikes took place in the 2000s, with the price temporarily moving above $10. However, the average price for the period was between $5 and $7. The current well head price has now moved into that zone. Adjusting for inflation, the current price is still cheaper than the price in the late 2000s—but not that much cheaper.

Much commentary on natural gas compares the 2012 price lows of around $2-$3 dollars with the $10 highs of the 2000s. This is very misleading and obscures the fact that shale gas is expensive to produce. My definition of a product revolution would be one with lower price and higher volume—integrated circuits being the classic case. Shale gas does not fulfil this definition. When price falls, production growth struggles; only with high price do you get production uplifts.

Nonetheless, despite U.S. gas prices trending above $5, the U.S. spot price remains significantly below the price in other markets as the chart below shows (taken from BG Group presentation here, click for larger image). Note that NBP refers to the ‘national balancing point’, the benchmark wholesale spot price of natural gas in the UK.

Global Natural Gas Prices jpeg

Until liquid natural gas (LNG) production and export facilities come on stream in the U.S., traders cannot arbitrage between domestic and international markets, so the divergence in prices will remain. When such facilities are available, the critical question is whether U.S. production can be ramped up to allow exports, and whether the volumes will be significant enough to impact on global market prices.


Data Watch: US and Global Crude Oil Monthly Production April 2014 Releases

On April 30th, the U.S. government agency The Energy Information Administration (EIA) announced provisional U.S. crude oil production figures for February 2014. Key points:

  • February crude oil production was 224.9 million barrels, equivalent to 8.0 million barrels per day (bpd)
  • Change over February 2013 on a barrel-per-day basis: +12.8% y/y
  • February total crude oil plus natural gas liquids reached 300.0 million barrels, equivalent to 10.7 million bpd
  • Growth continues to remain in the double digits year-on-year.

As can be seen from the chart below (click for larger image, link to original data here), the fracking of tight oil formations in the U.S. has made a major impact on U.S. crude production over the last few years.

US Field Crude Oil Production April 2014 jpeg

Given crude oil is a globally traded commodity, U.S. production numbers need to be placed in the context of world supply and demand. The International Energy Agency (IEA), in its latest Oil Market Report (OMR) dated 11 April 2014, recorded global ‘all liquids’ (oil and condensate) production of 91.8 million bpd for March 2014. Year-on-year supply growth is averaging around 1 million bpd, or a little over 1%.

OPEC and Non-OPEC Oil Supply March 2014 jpeg

Mirroring supply, benchmark crude prices continue to bump along a plateau. Increased U.S. production is being offset by a reduction in OPEC output, particularly with respect to Libya and Iraq. As a result, both WTI and Brent have remained above $100 per barrel.

Crude Futures March 2014 jpeg

Full quarterly IEA world supply-and-demand figures, including 2013 provisional supply and demand numbers, together with 2014 forecasts, can be found here. Interestingly, 2013 supply is now given as averaging 91.6 million bpd, up only 0.6 million bpd from 2012. Successive articles in the media have pronounced peak oil dead due to the fracking of shale. This story is everywhere—except in the actual numbers, where almost no increase in supply can be seen.

Data Watch: US Natural Gas Monthly Production December 2013

The US government agency the Energy Information Administration (EIA) issues data on U.S. natural gas production, including shale gas, on a monthly basis with a lag of roughly two months. The latest data release was made on February 28th, and covers the period up until end-December 2013.

Data is reported in billion cubic feet (bcf). Key points:

  • December 2013 natural gas dry production: 2,090 bcf, plus 2.1% year-on-year
  • Average monthly production for the 12 months to December 2013: 2,023 bcf, +0.9% over the same period the previous year

Since the end of 2011, production growth has stalled (click chart below for larger image), with the year-on-year 12-month average bumping along a plateau.

US Dry Gas Production Dec 13 jpeg

Natural gas well-head prices exhibit seasonality, with winters generally seeing stronger prices due to heating needs. The recent polar-vortex induced cold snap in the U.S. has pushed prices up to their highest since February 2010 (here, click for larger image).

Natural Gas Spot Prices Mar 3 jpeg

To put the current price of $5.0 per million British thermal uni (Btu) in perspective, a longer term monthly time series going up until end December 2012 is given below (click for larger image). Note that natural gas production is very inelastic over the short term. Accordingly, the market is brought back into equilibrium during periods of strong demand through large jumps in price. However, these don’t generally prompt an investment surge in natural gas infrastructure since they are viewed as temporary in nature. Only if prices remain elevated beyond winter would we likely see a supply-side response. However, prices are already coming off their highs as we move toward spring.

US Nat Gas Well Head LT jpeg

Data Watch: US and Global Crude Oil Monthly Production February 2014 Releases

On February 27th, the U.S. government agency The Energy Information Administration (EIA) announced provisional U.S. crude oil production figures for December 2013. Key points:

  • December crude oil production was 243.8 million barrels, equivalent to 7.9 million barrels per day (bpd)
  • Change over December 2012 on a barrel-per-day basis: +11.1% y/y
  • December total crude oil plus natural gas liquids reached 324.8 million barrels, equivalent to 10.5 million bpd

The last three months have seen a sharp drop in production growth rates from the high teens to just over 10%. It is too early to tell if this is just a temporary blip or something more permanent.

As can be seen from the chart below (click for larger image, link to original data here), the fracking of tight oil formations in the U.S. has made a major impact on U.S. crude production over the last few years.

U.S. Field Production of Crude Oil Jan 14 jpeg

Given crude oil is a globally traded commodity, U.S. production numbers need to be placed in the context of world supply and demand. The International Energy Agency (IEA), in its latest Oil Market Report (OMR) dated 13 February 2014, recorded global ‘all liquids’ (oil and condensate) production of 92.1 million bpd for January 2014. Year-on-year supply growth is averaging around 1 million bpd, or a little over 1%.

OPEC and Non-OPEC Oil Supply Jan 14 jpeg

In this month’s OMR, the IEA emphasises that exuberant expectations with respect to the impact of U.S. production on world supply and demand have been disappointed. Outages in Libya, disappointing production in Iraq and higher-than-expected OECD demand have more than offset increased U.S. output (click for larger image).

Glut jpeg

As a result, benchmark crude prices continue along an elevated plateau.

Benchmark Crude Prices jpeg

Full quarterly IEA world supply-and-demand figures, including 2013 provisional supply and demand numbers, together with 2014 forecasts, can be found here.