Category Archives: Peak Oil

Data Watch: US Natural Gas Monthly Production December 2013

The US government agency the Energy Information Administration (EIA) issues data on U.S. natural gas production, including shale gas, on a monthly basis with a lag of roughly two months. The latest data release was made on February 28th, and covers the period up until end-December 2013.

Data is reported in billion cubic feet (bcf). Key points:

  • December 2013 natural gas dry production: 2,090 bcf, plus 2.1% year-on-year
  • Average monthly production for the 12 months to December 2013: 2,023 bcf, +0.9% over the same period the previous year

Since the end of 2011, production growth has stalled (click chart below for larger image), with the year-on-year 12-month average bumping along a plateau.

US Dry Gas Production Dec 13 jpeg

Natural gas well-head prices exhibit seasonality, with winters generally seeing stronger prices due to heating needs. The recent polar-vortex induced cold snap in the U.S. has pushed prices up to their highest since February 2010 (here, click for larger image).

Natural Gas Spot Prices Mar 3 jpeg

To put the current price of $5.0 per million British thermal uni (Btu) in perspective, a longer term monthly time series going up until end December 2012 is given below (click for larger image). Note that natural gas production is very inelastic over the short term. Accordingly, the market is brought back into equilibrium during periods of strong demand through large jumps in price. However, these don’t generally prompt an investment surge in natural gas infrastructure since they are viewed as temporary in nature. Only if prices remain elevated beyond winter would we likely see a supply-side response. However, prices are already coming off their highs as we move toward spring.

US Nat Gas Well Head LT jpeg

Links for the Week Ending 2 March 2014

  • Martin Wolf has been revisiting the robots and jobs topic over the past few weeks in a couple of articles in The Financial Times here and here (free access after registration). This is a theme I have been addressing a lot recently in a series of posts starting here. Wolf finishes his last article with the observation that technology does not always have to shape institutions; it should be the other way around: “A form of techno-feudalism is unnecessary. Above all, technology itself does not dictate the outcomes. Economic and political institutions do. If the ones we have do not give the results we want, we must change them.” I agree, but this will not be easy.
  • I have also just discovered a fascinating blog that pulls together articles on the new robot economy called RobotEnomics (sic). For example, check out this post on the economic implications of driverless cars.
  • California has experienced significant rainfall over the last few days. The latest Drought Monitor (released weekly) doesn’t capture this rainfall, so we should see some slight improvement when the next update comes out. Critically though, California’s water bank—its high mountain snow pack—is still running at around 20% of average. You can see the end month figures as measured by the Department of Water Resources here and an article giving background to the snowpack hereMother Jones has some nice graphics on the crops being hurt by the drought here, while The Atlantic has a very interesting (and very long) article on the history and future of California’s massive water engineering projects here.
  • Here I go again: linking to the March 1998 Campbell and Laherrere article titled “The End of Cheap Oil” in Scientific American. The authors ended the article with this sentence “The world is not running out of oil—at least not yet. What our society does face, and soon, is the end of the abundant and cheap oil on which all industrial nations depend.” Average price of Brent crude in 1998: $13.2 per barrel, equivalent nowadays to around $19 after adjusting for inflation. Brent now: $109 per barrel. But isn’t fracking going to give us an endless supply of cheap oil?  Here is an article in Bloomberg titled “Dream of Oil Independence Slams Against Shale Costs”. In other words, Campbell and Laherrere continue to be proved right and the energy cornucopians continue to be proved very wrong.
  • For technological optimists the dream is for a transformational technology that can permanently alter the energy supply equation. Fusion has always been one such hope, but forever decades away from commercial development. The New Yorker has just published a superb article called “A Star in a Bottle” on the International Experimental Thermonuclear Reactor (ITER) being built in France. The audacity and scope of the project is extraordinary. Yet my takeaway from the article is that fusion provides little hope of providing a timely saviour with respect to either climate change or fossil fuel depletion.

Data Watch: US and Global Crude Oil Monthly Production February 2014 Releases

On February 27th, the U.S. government agency The Energy Information Administration (EIA) announced provisional U.S. crude oil production figures for December 2013. Key points:

  • December crude oil production was 243.8 million barrels, equivalent to 7.9 million barrels per day (bpd)
  • Change over December 2012 on a barrel-per-day basis: +11.1% y/y
  • December total crude oil plus natural gas liquids reached 324.8 million barrels, equivalent to 10.5 million bpd

The last three months have seen a sharp drop in production growth rates from the high teens to just over 10%. It is too early to tell if this is just a temporary blip or something more permanent.

As can be seen from the chart below (click for larger image, link to original data here), the fracking of tight oil formations in the U.S. has made a major impact on U.S. crude production over the last few years.

U.S. Field Production of Crude Oil Jan 14 jpeg

Given crude oil is a globally traded commodity, U.S. production numbers need to be placed in the context of world supply and demand. The International Energy Agency (IEA), in its latest Oil Market Report (OMR) dated 13 February 2014, recorded global ‘all liquids’ (oil and condensate) production of 92.1 million bpd for January 2014. Year-on-year supply growth is averaging around 1 million bpd, or a little over 1%.

OPEC and Non-OPEC Oil Supply Jan 14 jpeg

In this month’s OMR, the IEA emphasises that exuberant expectations with respect to the impact of U.S. production on world supply and demand have been disappointed. Outages in Libya, disappointing production in Iraq and higher-than-expected OECD demand have more than offset increased U.S. output (click for larger image).

Glut jpeg

As a result, benchmark crude prices continue along an elevated plateau.

Benchmark Crude Prices jpeg

Full quarterly IEA world supply-and-demand figures, including 2013 provisional supply and demand numbers, together with 2014 forecasts, can be found here.

Links for the Week Ending 7 February 2014

  • Now is the time of year when a young (and not so young) person’s fancy lightly turns to thoughts of skiing (not least because of the Sochi Winter Olympics). Few, however, like to talk about the threat that climate change poses for winter sports. This spectre at the feast is met with passive denial—if we pretend it isn’t there, perhaps it will go away. So it is rare to hear a voice from within the industry itself, such as that of Powder Magazine‘s Porter Fox in an Op-Ed piece titled ‘The End of Snow?”  in The New York Times, calling for action.
  • Fox references a paper by the National Resources Defence Council (NRDC) called “Climate Impacts on the Winter Tourism Economy in the United States” if you like to dig into data.
  • Two weeks ago, I referenced a Mark Lewis article in The Financial Times disputing the peak demand theory for oil (here, free registration at the FT). As a contrast, I thought it worthwhile referring back to a 2013 Steve Kopits interview on resilience.org which gives the opposing argument (here). Personally, I believe that the intersection between price, demand destruction and supply response  is too complex to forecast accurately, particularly as these factors all play out over different time horizons. That said, my gut feeling is that oil is already putting a break on GDP growth at the margin, with more turbulence to come.
  • The U.K. has been plagued by floods over the last couple of months, with the head of the Environment Agency Lord Smith becoming the fall guy for middle England’s frustrations. In a frank letter to The Daily Telegraph, Smith had the temerity to argue that difficult choices have to be made, but this position has produced outrage in the shires. I always find irony in the fact that the political right argues for self-reliance yet runs crying to the state whenever it finds itself on the wrong end of climate change.
  • Southern Europe has become Ground Zero for the collapse narrative. And here is a post by one of my favourite bloggers Ugo Bardi of Cassandra’s Legacy looking at the situation in Italy. And a conversation between Bardi and Dmitry Orlov on the same topic can be found here.

Energy Return on Investment (EROI): State of Play

In my last post, I referred to the work of Charles Hall on Energy Return on Investment (EROI) and biophysical economics. Following an exchange of e-mails with Professor Hall,  he directed me to some of his more recent work, including a January 2014 paper titled “EROI of Different Fuels and the Implications for Society” published in Energy Policy (free access). The paper looks at the critical EROI question: “How many units of energy do you extract for each unit of energy you invest?”.

The paper is a veritable chartfest of all things EROI, but I will wet your appetitive with just three. First up, is an EROI comparison between different fossil fuel and biomass energy sources (click for larger image).

Mean EROI jpeg

The bad news here is that coal remains the king of EROI since you get around 40 times as much energy out for each unit of energy you put in. Hardly good for CO2 emissions trajectories and climate change.

Next up is the decline in global oil and gas EROIs (click for larger image):

Global Oil and Gas EROIs jpeg

The decline is unsurprising since we are trying to exploit ever more geologically marginal sources of oil and gas in ever more unconventional forms.

Finally, a chart showing fossil fuels up against renewables (click for larger image):

EROIs Different Energy Sources jpeg

I was genuinely surprised at this one because both wind and photovoltaic (PV) came in higher than I expected. Hall flags all the major problems with wind and PV (need for base load and so on) and also points to disputes over PV EROI methodology. Nonetheless, I have heard arguments in the past that PV is almost break-even in EROI terms; this does not appear to be the case.

There is a lot more in the paper, including numerous interesting references. When I get time, I will come back to the EROI of renewables as it seems such an important topic.

Should We All Give Up?

The frustration within the sustainability and resilience blogosphere is palpable. Oftentimes it is expressed in terms such as this: “Why even bother communicating with the mainstream, when the mainstream has no intention of listening?”

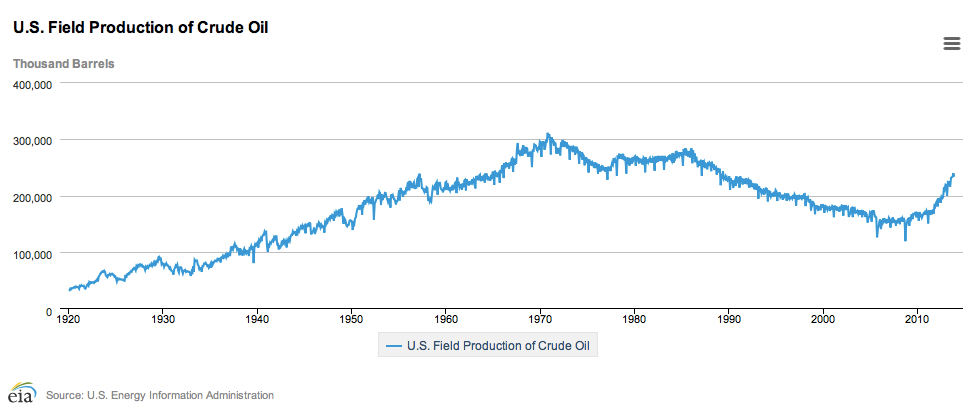
But ideas have a life of their own, and many are gradually infecting the mainstream, without the mainstream even being aware of their origin. For example, take the chart below titled “Costly Quest” taken from a Wall Street Journal article published on 28 January (behind paywall here, click for larger image):

Majors Oil Production jpeg

This is a classic case of the Red Queen syndrome, under which Big Oil has to run ever faster purely in order to stand still; that is, ever more investment for the same level of production. (A previous post dealt with the Red Queen and shale gas here.)

The Red Queen can also be described another way: a decline in the energy return on investment (EROI), under which you have to put ever more energy into an extraction and production process just to get the same amount of energy out.

EROI was first conceived of by the systems ecologist Charles Hall who later developed it more deeply into the discipline called biophysical economics, the best exposition of which can be found  in the book “Energy and the Wealth of Nations” by Hall and co-author Kent Klitgaard.

You can listen to a recent 19 January 2014 podcast by Hall talking about EROI and biophysical economics at Progressive Radio Network at the link below. Don’t get put off by the weird bird noises at the beginning. The podcast starts one minute in and Hall gets on to fossil fuel depletion issues about 25 minutes into the podcast. The first 25 minutes are still interesting as they explain how Hall got involved in biological energy systems when studying migrating salmon.

http://prn.fm/resistance-radio-charles-hall-011914-2/

At the height of the credit crisis, the revolutionary ideas espoused by advocates of biophysical economics chimed with the times and even got an airing in the mainstream media, as, for example, in this article in The New York Times in 2009.

Five years on and this intellectual strand of thought remains marginalised, as Joseph Tainter, one of the movements most high profile supporters predicted back then:

“Of course I’m trying to send a message,” said Joseph Tainter, chairman of Utah State University’s Department of Environment and Society. “I just don’t expect there’s anyone out there to receive it.”

And many who tried to get the message out have given up, the demise of The Oil Drum being, perhaps, the most famous example. Similarly, we got a post from the blogger Question Everything yesterday making a very definitive statement:

What follows is actually something that has been brewing for a while. I started writing this a little over a year ago. A recent e-mail list exchange with some other people who have been blogging, mostly about things like climate change, energy depletion, and the collapse of civilization, reminded me of my own evolution in thinking. Several well-known luminaries in the blog and book-writing world have begun to voice a kind of remorse that their voices have been ignored. Meanwhile the world has careened toward the consequences they have warned us of. And now they are realizing that they have been tilting at windmills. Somewhere along the line I did too…..

…..In any case I plan to no longer concern myself with warning of imminent collapse or a bottleneck. In all likelihood I may, from time to time, simply mention another signpost along the way, like the current draught problems in California as indications that climate change is having its effects much sooner than expected. But I won’t dwell on how it could have been different if only people would have listened to the warnings and taken heed. I won’t complain about those in governments being so incredibly stupid and foolish. I’ve said quite enough about it already. Think of this as a kind of retirement from the role of a Cassandra.

My own position is somewhat less gloomy. Why should we be so surprised that a well-financed climate skeptic lobby would have emerged after Al Gore’s “Inconvenient Truth” and the Intergovernmental Panel on Climate Change  “Fourth Assessment Report” in 2007? Or surprised that, with an oil price spiralling above $100 per barrel, the fossil fuel industrial complex would throw more cash and technology at getting marginal barrels of oil out of the ground?

My optimism rests on the fact that our problems cannot be permanently ignored: the planet will continue to warm and energy prices will continue to rise. In The New York Times article back in 2009, Hall was quoted thus:

“It isn’t that there’s no technology,” Hall said. “The question is, technology is in a race with depletion, and that’s a whole different concept. And we think that we can show empirically that depletion is winning, because the energy return on investment keeps dropping for gas and oil.”

This is basically the core idea behind The Wall Street Journal article I commenced the post with.

So should we all give up? I think my answer is “no”: every idea has its time and biophysical economics is an idea whose time is just arriving. From the heretical to the mainstream in tiny incremental steps. Indeed, in the not too distant future, even The Wall Street Journal will believe in the idea of peak oil and dangerous anthropogenic climate change. You may call me stupid and naive; I prefer to see myself as patient.

Data Watch: US Natural Gas Monthly Production November 2013

The US government agency the Energy Information Administration (EIA) issues data on U.S. natural gas production, including shale gas, on a monthly basis with a lag of roughly two months. The latest data release was made on January 31st, and covers the period up until end-November 2013.

Data is reported in billion cubic feet (bcf). Key points:

  • November 2013 natural gas dry production: 2,047 bcf, plus 2.4% year-on-year
  • Average monthly production for the 12 months to November 2013: 2,020 bcf, +0.8% over the same period the previous year

Since the end of 2011, production growth has stalled (click chart below for larger image), with the year-on-year 12-month average bumping along a plateau.

US Dry Gas Production Nov 13 jpeg

Natural gas well-head prices exhibit seasonality, with winters generally seeing stronger prices due to heating needs. The recent polar-vortex induced cold snap in the U.S. has pushed prices up to their highest since February 2010 (here, click for larger image).

Natural Gas Spot Prices Jan 14 jpeg

To put the current price of $5.5 per million British thermal uni (Btu) in perspective, a longer term monthly time series going up until end December 2012 is given below (click for larger image). Note that natural gas production is very inelastic over the short term. Accordingly, the market is brought back into equilibrium during periods of strong demand through large jumps in price. However, these don’t generally prompt an investment surge in natural gas infrastructure since they are viewed as temporary in nature. Only if prices remain elevated beyond winter would we likely see a supply-side response.

US Nat Gas Well Head LT jpeg

It’s That Time of Year Again (To Despair)

Although my blog is titled “The Rational Pessimist”, I am definitely ‘a cup half full’ kind of guy personality-wise. In a crappy situation, I will generally try to focus on the positive. But reading BP’s latest “Energy Outlook”, a publication that comes out every January, it is difficult to avoid despondency. Here is the latest edition, which was published a couple of days ago.

The charts within this publication are depressing enough, but more so is BP’s concluding slide (click for larger image):

BP Energy Outlook Conclusion jpeg

For those not familiar with the publication, the BP Energy Outlook forecasts energy supply and demand out a couple of decades or so. For the January 2014 publication, we are now looking out to 2035, compared with the forecast to 2030 in the January 2013 edition.

Apart from all the numbers for oil, gas, coal, renewables and so on, the latest Outlook also gives a prediction for CO2 emissions out to 2035. This is what they are referring to when they use the word ‘sustainable’ and this is what they define as having ‘room for improvement’. This is how I would reword the last bullet point:

Sustainable?
– No, A Frigging Disaster

How on earth can you regard this chart as merely demonstrating ‘room for improvement’?

Emissions by Region jpeg

The red dotted line is the International Energy Agency’s simulated emission path required to keep the atmospheric concentration of CO2 below 450 parts per million, the consensus (although somewhat arbitrary) limit deemed necessary to prevent dangerous climate change.

Is there any silver lining for this dark cloud? Continue reading

Data Watch: US Natural Gas Monthly Production October 2013 Plus a Review of EIA’s Medium- and Long-Term Forecasts

Apologies for the late reporting of this number; my brain has been occupied with job-eating robots and computers for the last few weeks (and another post on this theme to come).

Apart from getting the latest monthly US natural gas number, I also want to do a quick catch up on The Energy Information Administration (EIA)’s “Annual Energy Outlook 2014″, which came out in mid-December and the “Short Term Energy Outlook” that came out on January 7th with new 2015 numbers.

But first the monthly number: the US government agency the EIA issues data on U.S. natural gas production, including shale gas, on a monthly basis with a lag of roughly two months. The latest data release was made on January 7th, and covers the period up until end-October 2013.

Data is reported in billion cubic feet (bcf). Key points:

  • October 2013 natural gas dry production: 2,007 bcf, plus 0.6% year-on-year
  • Average monthly production for the 12 months to October 2013: 2,015 bcf, +0.7% over the same period the previous year

Since the end of 2011, production growth has stalled (click chart below for larger image), with the year-on-year 12-month average now flat-lining.

US Dry Gas Production Oct 2013 jpeg

Natural gas well-head prices exhibit seasonality, with winters generally seeing stronger prices due to heating needs. The recent polar-vortex induced cold snap in the U.S. has also been supporting prices over recent weeks (here, click for larger image).

US Nat Gas Spot Prices Jan 14 jpeg

To put the current price of $4.5 per million Btu in perspective, a longer term monthly time series going up until end December 2012 is given below (click for larger image). Continue reading

Links for the Week Ending 28 December

Apologies for my absence, but I have been super busy over the holiday period.

  • Liam Halligan in The Daily Telegraph explains why oil prices will likely remain high in 2014. It’s a well-worn story in this blog, but Halligan provides a nice recap on the disappearance of “easy oil”. In his words: “The ‘upstream’ oil industry capital expenditure has risen, in constant dollars, from $250bn in 2000 to $700bn last year – almost a threefold increase. Over the same period, global oil supply rose just 14%.” In sum, shale oil is no free lunch.
  • Staying with The Telegraph, Ambrose Evans-Pritchard gives praise where praise is due with respect to the Fed and QE. I still think that the uber-aggressive version of QE we have witnessed in the US will only be vindicated once it is unwound. The imbalances it is causing are many, but they have manifested themselves in asset inflation not generalised inflation. Nonetheless, with both structural reform and active fiscal policy missing in action during the Great Recession, it was left to the Fed to stop the sky from falling down—which is what the Fed did, so all kudos to them. The next question is: can the US growth without QE? We shall see.
  • Being ‘poorer than your parents’ is  a hot topic on both sides of the Atlantic. Bloomberg has a lovely article comparing a dad and a daughter, but the statistics on US savings and pensions levels are what shocked me most. How will those boomers live through retirement with that amount of money?
  • Over the pond (and less anecdotal), the Institute for Fiscal Studies (IFS) has just published a report looking at the economic circumstances of different cohorts born from the 1940s to 1970s. Conclusion: for the middle-aged, you have little chance of matching your parents prosperity in your later years unless you can nail down a significant inheritance. If you don’t want to read the whole report, you can see a good synopsis in The Guardian here, but almost all the UK national press, whether from the left or right, reported on the IFS study.
  • Previously in the Links, I flagged Larry Summers speech at an IMF symposium. Here he is again talking about long-term economic stagnation in The Financial Times.
  • I frequently mention the thought-provoking work of Tyler Cowen, and have just finished reading his latest book “Average Is Over“. David Brooks has a nice piece in The New York Times expanding on Cowen’s employment theme and thinking about what type of people can thrive as technology upturns the job market.
  • And last but not least, over to climate change. The Carbon Brief has a wonderful post on the five-most important climate change papers of 2013, including the key charts. Required reading for anyone who has bought into the idea that the current temperature hiatus has lowered the risk posed by climate change. But then again, such a reader would be unlikely to stray far from Watts Up with That.