On April 29th, the U.S. government agency The Energy Information Administration (EIA) announced provisional crude oil production figures for February 2013. Key points:
- February crude oil production 217.1 million barrels, equivalent to 7.2 million barrels per day
- Change over previous month, + 2.4% on barrels per day (bpd) basis; year-on-year change, +10.9% on bpd basis
- February total crude oil plus natural gas liquids 269.6 million barrels, equivalent to 9.6 bpd
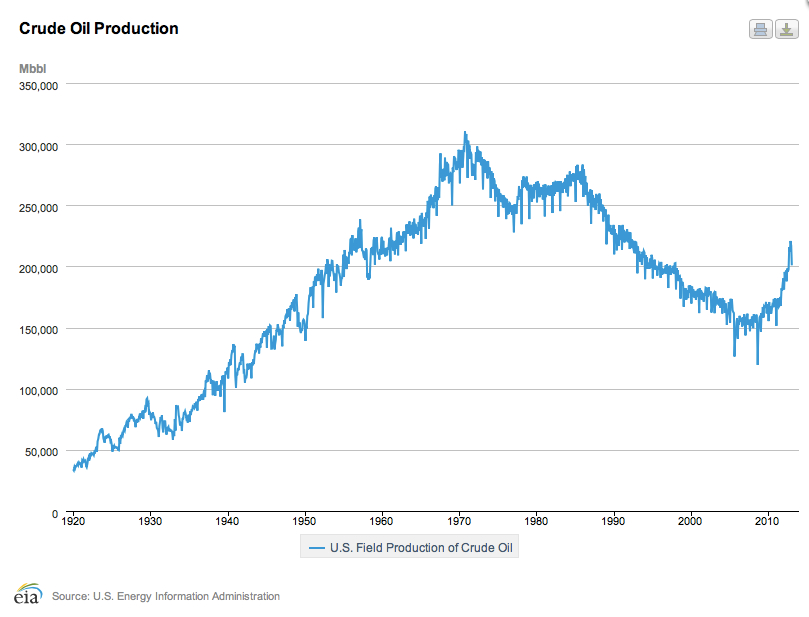
As can be seen from the chart below (click for larger image, link to original data here), the fracking of tight oil formations in the U.S. has made a significant impact on U.S. crude production. The critical question is whether the current large year-on-year percentage growth rates in oil production can be sustained (click for larger image).
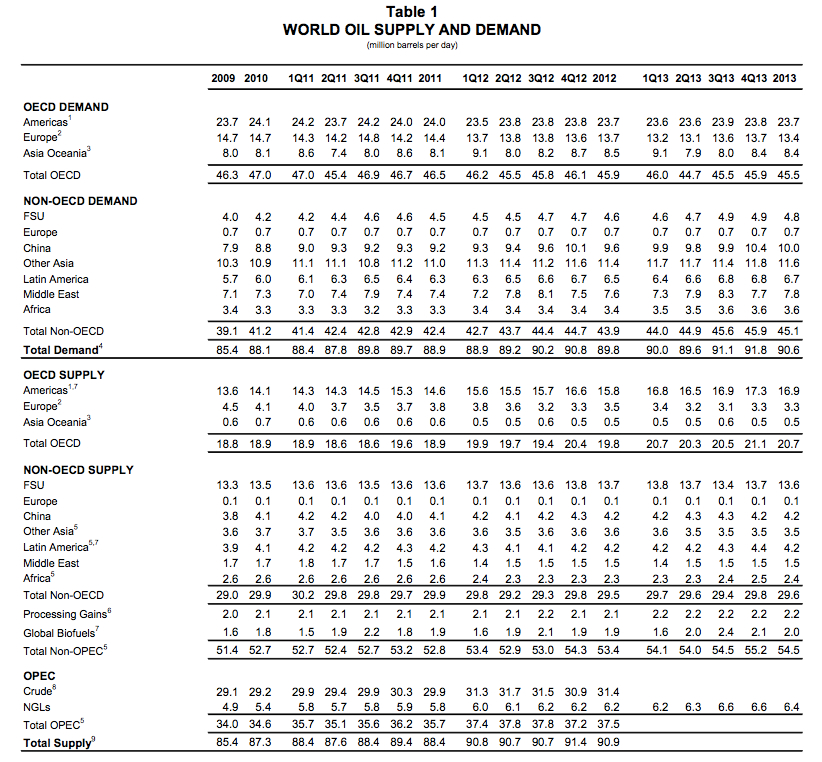
Crude oil is a globally traded commodity, and U.S. production numbers need to be placed in the context of world supply and demand. In its April 2013 Oil Market Report, the International Energy Agency (IEA) records global ‘all liquids’ production as averaging 90.6 million bpd in Q1 2013, flat over the same period the previous year.
For March 2013, global supply was 90.7 million bpd (here). Over the last 3 months, rises in non-OPEC supplies have been offset by falls within OPEC. The degree to which this is due to supply constraints or deliberate production cuts by Saudi Arabia to maintain the oil price above $100 per barrel in the face of a slowing global economy is difficult to tell.

Full quarterly IEA world supply-and-demand figures, including Q3 2013 estimates, can be found here. Click for larger image to see the summary table.