In my previous post, I suggested that we are on the cusp of putting electric vehicle (EV) range issues behind us. Two distinct technologies are overcoming the range problem: the growth of fast charging networks and the rise in the energy capacity of EV batteries. In this post, we are going to drill further down into the energy capacity issue.
In the past, the battery constraint has been size and weight. Producing a battery that can deliver 400 or 500 miles of continuous driving is relatively easy: you just make the battery ever bigger. The problem has been delivering the required energy capacity within a sensibly sized and weighted unit. The Tesla Model 3 battery comes in at 478 kg, contains 75 kilowatt hours (kWh) of energy and can propel the car 310 miles between charges according to the US Department of Energy. In the Tesla Model 3, for every 1 kg of battery we get 157 watt hours (Wh). This is called the specific energy of the battery, or the gravimetric energy density, and is measured in watts-hours per kilogram.
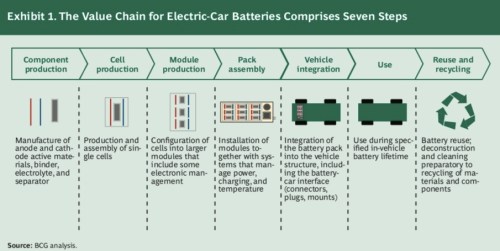
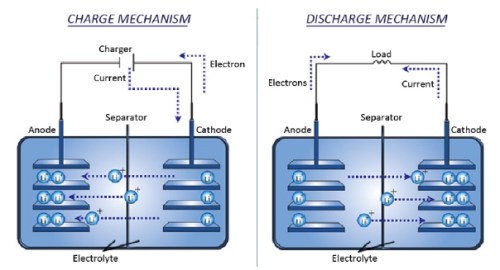
I mentioned that the Model 3 has a 478 kg battery. We are really talking about the battery pack here, which incorporates a number of battery modules, which in turn incorporate a number of battery cells. As is the case of many things EV, we are frequently faced with the problem of comparing apples and pairs. That is, if we want to compare specific energy figures between vehicles, we need to compare like with like: battery pack with pack, module with module or cell with cell. The building of a battery, from components, to cells, to modules, to the pack can be seen in the illustration below (source: here):
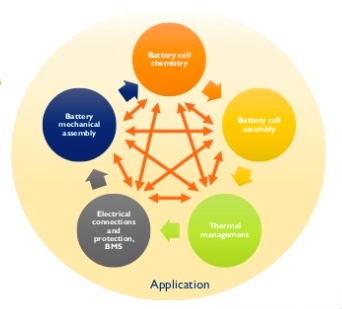
The combination of the battery elements is a complex interlocking process involving a lot of different disciplines such as chemistry, electrical engineering and mechanical engineering. And it also involves trade-offs. Securing specific energy gains in one area can result in losses in another.
For example, the Tesla Model 3 uses state-of-the-art Panasonic ‘2170’ battery cells that are likely the highest specific energy battery cells deployed in mass production cars. (Note that the 2170 number represents the dimensions of the battery cell not the battery chemistry; 21 mm is the diameter and 70 mm the length.) But the battery chemistry employed in these cells is quite difficult and requires a sophisticated cell management and heat control system to prevent thermal runaway; i.e., the battery catching fire. Obviously, the more sophisticated and complex the cell management system, the more the overall battery pack is bulked up.
Of course, by definition, battery cells have a far greater specific energy (gravimetric energy density) than the battery pack since all the battery pack parts surrounding the cells have zero specific energy. In the Tesla Model 3 tear down that I referred to in a previous post, Jack Rickard extracted the four modules that go into the Tesla Model 3 battery pack. They are slightly uneven in size. Two of the modules contain 1,058 cells and two contain 1,150 cell, so the overall battery pack has 4,416 cells in total. Jack also weighed the modules: in total they came to 362 kg. So with usable energy of 75 kWh, the modules alone have a specific energy of 75 kWh divided by 362 kg, which translates to 207 Wh/kg (Jack blogged about this tear down here). From the top of the post, remember that the specific energy of the battery pack in its entirety was 157 Wh/kg.
We can go even further down to the specific energy of the individual cells. Before we do that, here is a short video of a Tesla Model 3 ‘2170’ cell being dissected:
Surprisingly, I’ve struggled to find an official weight for each individual battery cell. From a Tesla forum conversation, I have seen a figure of 66 grams quoted, but I can’t verify this. Until I get a definitive number, however, I will run with 66 grams as it likely to be only a few grams out. So if we have 4,416 cells each weighing 66 grams, that gives us a total weight for the cells alone of 291 kg. This time, let’s divide the total energy of the battery pack, 75 kWh, by this new figure. The results is that each cell has a specific energy density of 257 Wh/kg. Compared with the theoretical maximum specific energy density of around 400 Wh/kg, you can see that there is the potential for some future efficiency gains but not transformational ones.
In the Model 3, Tesla has a car that can compete with ICE rivals such as Audi, BMW and Mercedes, but for Tesla to utterly dominate all its competitors it would be helpful if we could get its driving range even higher than 310 miles between charges. How easy is it for Tesla to do that within the existing battery chemistry limitations highlighted above?
First, let’s focus on the non-cell components in the battery pack. We already established that the battery cells weigh 291 kg in total. If we take that number away from the overall battery pack weight of 478 kg, then the non-cell components weigh 187 kg. Let’s say that through mechanical and electrical engineering incremental improvements, we reduce the non-cell weight of the battery by 12% per annum for three years; in other words by roughly one third. That will free up about 65 kg out of that 187 kg.
Next we allocate that 65 kg to install more cells. So the cell weight goes from 291 kg to 356 kg. That’s a 22% increase. If we hold the specific energy of the cells constant at 257 Wh/kg, we now have a 91.5 kWh cell pack that should give us a range of 378 miles.
Turning now to the battery chemistry, we recognise that specific energy improvements are harder to achieve in this area than improvements in electrical or mechanical engineering. So for the cells, let’s assume Tesla and Panasonic improve the specific energy by 6% per annum for the next 3 years. That will result in specific energy going from 257 Wh/kg to 306 Wh/kg, an improvement of 19%. With our 19% improvement, the battery now goes from 91.5 kWh to 109 kWh and range improves from 378 miles to 450 miles between charges. At a 450-mile range, I declared in my previous post that all worries over EV range would disappear.
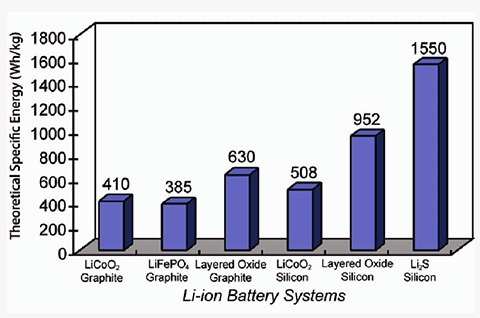
In a perfect world, I would like to not only get up to a 450-mile range but also shrink the battery weight and size. But for that, we probably need to wait for a jump in battery technology that delivers specific energy north of 500 Wh/kg. There are a variety of advanced batteries in the pipeline that aim to do just that as can be seen below. Nonetheless, we have yet to see any that are close to commercial production.
The conclusion of this post, nonetheless, is that even with only incremental improvements in existing technology, EV powertrains (plus their batteries) are getting very close now to matching or exceeding ICE powertrains (plus their fuel tanks) in every single area of performance. Throughout this discussion, however, I have left out one critical parameter: cost. That will be the subject of my next post.
When Jack Rickard pulled the battery out of a wrecked extended range Model 3 in a previous post, it weighed in at 478 kg. We are talking here of a 75 kilowatt-hour (kWh) battery. If you have a high tolerance for ‘slow video’ then you can see Jack, together with Bill from Ace Hardware, Linden, Tennessee, extract the battery from a Model 3 (I rather like Jack’s vlogging style, but then perhaps I should get out more).
Let us put this battery into some kind of context. If we divide the energy storage of the 75 kWh Tesla battery Jack Rickard extracted by its weight of 478 kg we get 0.157 kWh per 1 kg of weight. Let’s change our unit from kilowatts to watts: so we get 157 watt hours (Wh) per kg. Note we are talking about the entire battery here, not the battery cells.
The measure of the amount of energy per unit of weight is referred to as the specific energy or gravimetric energy density. If you are building EVs you want to have as high as possible specific energy for your battery. Each technological advance then allows you to either store the same amount of energy for less weight, or store more energy for the same amount of weight.
When you compare EVs with internal combustion engines (ICEs), the EV basically wins hands down with respect to the delivery of power. So boosting the specific energy of the battery is about having more energy in your battery (rather than power). This, in turn, gives your car more mileage range. Indeed, a critical goal in battery development is to boost specific energy to such an extent that mileage range becomes a non-issue. Nonetheless, even if your battery can deliver all the possible miles that an owner could wish to drive in one sitting, an incentive still exists to boost specific energy even further because that would allow you to continually shrink the battery.
Keep in mind that the Model 3 Tesla battery Jack extracted weighs 28% of the overall vehicle weight. So let’s do a thought experiment and imagine that Tesla doubles the specific energy of the battery to 300 watt hours per kg (wh/kg).
The current Tesla Model 3 has a range of 310 miles according to the US government’s Environment Protection Agency (EPA); pretty good, but I should think the consumer is greedy for more. Let’s decide to increase the mileage range by 50% to around 450 miles between charges. With our new 100% specific energy improved battery we could deliver 450 miles plus shrink the battery by 25% to about 325 kg. We are, in effect, lightening the car by over 100 kg. And, if we are lightening the car by 100 kg, we are making it more efficient.
The extended-range Model 3 weighs in at 1,730 kg; if we drop 100 kg in weight, that translates into a weight saving of around 6%. And given a chunk of the battery’s energy is used up lugging the battery itself around, every time we shrink the battery we release energy that can be used for moving the rest of the vehicle and its occupants. This, in turn, allows us to shrink the battery further. In other words, we have a nice little positive feedback loop emerging here.
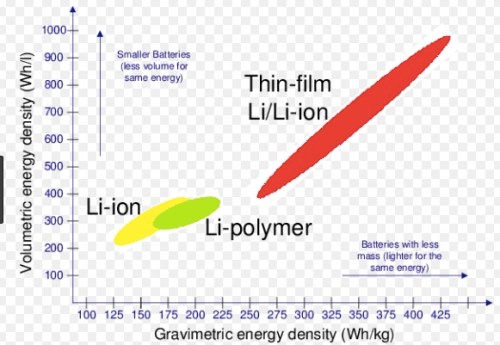
Specific energy is not energy density. The term energy density, or volumetric energy density, refers to the energy stored per unit of volume, or watts per litre (wh/l). In an ideal world, I would have loved it if Jack had also taken the dimensions of the extracted Tesla battery as well. Then we could have worked out a real-time energy density number for the Model 3 battery. In the chart below, however, you can see that a linear relationship exists between specific energy (termed here gravimetric energy density) and volumetric energy density. Therefore, as we achieve specific energy enhancements, we generally get energy density improvements as well.
Put another way, as you lighten the battery you will also reduce its size. And every time you do that, the size of the total drivetrain, including energy source, gets more competitive versus the ICE drivetrain plus fuel tank. Note that the EV has already won in the configuration competition with an ICE vehicle. You have far more latitude in arranging your drivetrain components with an EV since you are just connecting them up with wires. No crankshaft or gear box required.
Let’s talk a bit more about range. We’ve established that the extended range Tesla Model 3 can drive around 310 miles on a fully charged battery according to US government statistics. So we get 3.85 miles per kWh. Speed limits in the USA vary by state, but the highest speed limit is found in states like Texas and comes in at 75 mph. So our 310 mile range for the Tesla translates into roughly 4 hours 10 minutes of driving time in the high-speed-limit states, and that is assuming the entire journey is at the maximum speed limit.
Given the average motorist doesn’t wear adult diapers while driving, he or she will periodically need to get out of the car to urinate or defecate. Moreover, I propose that the need for a wee is the limiting factor here, so the act of urination is our boundary constraint (apologies to irritable bowel sufferers). According to WebMD, the average adult urinates between once every two to four hours. So I will take an ‘iron bladder’ as my example Tesla driver. Bottom line, the car will not run out of energy before the girl or boy has gotta go.
Nonetheless, we have to think about how long it takes to charge the car up again. And then we need to plug that number into an equation that also incorporates the time it takes to exit the car, hook it up to a recharging source, walk over to the toilet facility, urinate, walk back to the car, unhook the car from the charger and then drive off.
So does time to wee equate to time to charge? Curiously (at least for me), the “Law of Urination” states that mammals in general take 21 seconds to pee. So the actual act of urination is not the limiting factor here, rather accessing a place to urinate is the issue. For argument’s sake, I will assume that the toilet break is limited to 20 minutes since we need to walk to and from a toilet cubicle.
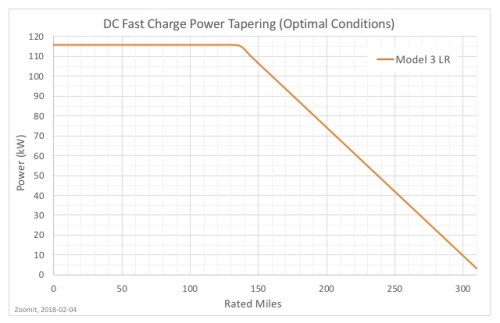
Next we need to know how long it takes to charge the Tesla. There are a lot of factors that come into play here including the starting charge of the battery, the desired ending charge of the battery and the quality of the charger. Given we are interested in the dynamics of a long road trip here, the driver is going to be using some kind of supercharger network. To get a sense of the charging experience at a Tesla Supercharger, check out the video here:
In the video, you can see a top charging rate of 100 kW, which translates into 375 miles added per hour. The theoretical top charging rate at a Tesla Supercharger is actually 115 kW, but as the battery gets close to being fully charged, the rate of charging drops off.
What can we deduce from all this? Well, if a long distance driver wants to do two back-to-back journeys of around 300 miles each at the top speed limit allowed in the USA and only needs one toilet break of 20 minutes, then the Model 3 can’t deliver that kind of range performance (but an ICE vehicle can). You currently need a good hour of charging in that scenario for your Model 3, even assuming access to the best possible charging rate at a Supercharger.
At this stage, you may point out that the vast majority of car journeys don’t include driving 600 miles straight in two back-to-back sessions with a 20 minute break in between. But that is not really the point. In an earlier post, I established the conditions needed for the auto market to tip between being ICE dominated and EV dominated. The condition was that an EV needed to match or exceed an ICE vehicle in every car attribute. So if an ICE vehicle is superior for long distance marathon driving, EV penetration will be slower.
Nonetheless, it is only the year 2018, and Tony Seba’s 95% EV penetration-rate target by 2030 is still 12 years away. Further, I think the EV is not that far away from matching an ICE for long-distance driving already for two reasons.
First, as the battery capacity gets bigger, the battery will still have a lot of juice when the driver reaches the first toilet stop. With a 50% bigger battery and a 450 mile initial range (achieved through charging overnight), 150 miles will be left in the battery at the first stop. So for leg number two of the journey, only half the charge time is required since we are only topping it up and not starting from zero. (Yes, we could talk about three back-to-back stages amounting to 900 miles, but the driver will eventually have to eat, and, as we get beyond the 99.9% percentile of typical journeys taken, I think we can view these as true outliers.)
Second, as each Supercharger generation is rolled out, the rate of charging will go up. Tesla has already flagged that the V3 Supercharger will arrive this summer and the rate of charge is likely to be between 200 kW and 250 kW, so a roadmap exists toward halving the best current charging time.
Beyond Tesla, two open standards exist that allow shared usage by vehicles produced by different auto makers. These are the CCS standard (backed by the CharIn consortium) and the CHAdeMO standard. CCS, promoted by the German auto makers amongst others, is working toward a charging rate of 350 kW as well as inductive wireless charging stations. The CHAdeMO consortium, which is principally composed of Japanese automakers and electric power companies, is aiming for a rate of 400 kW in the coming years. A good primer on fast-charging protocols can be founder here.
Both CCS and CHAdeMO are having to play catch-up with Tesla’s Supercharger network, which has just reached 10,000 sites worldwide. Undoubtedly, Tesla’s strategy of “build them and they will come” appears to be far superior to the opposition’s strategy of “we will build them when they ask for them”. You can check out Tesla’s global Supercharger network here.
Summing up, while I think access to fast charging facilities will become a non-issue in a few years time, the need for batteries to get better with respect to specific energy and density is still a pressing need if EVs are going to unseat the current dominance of ICE vehicles. Further, to get the required improvement, do we need a John Goodenough-style leap in battery technology or will a Tesla-style incremental improvement in existing technology suffice? That will be the subject of my next post.
About a 10 minute walk from my home in Oxford can be found the University of Oxford’s Inorganic Chemistry Laboratory. From my photo below, you can see that the building sports a series of blue plaques commemorating the laboratory’s greatest achievements.
The bottom one reads as follows:
Here in 1980, John B. Goodenough with Yoichi Mizushima, Philip C. Jones and Philip J. Wiseman identified the cathode material that enabled the development of the rechargeable lithium-ion battery. The breakthrough ushered in the age of portable electronic devices.
Goodenough, now aged 95, is still actively researching battery technology to this day. An affectionate review of Goodenough’s extraordinary career by the journalist Steve LeVine can be found here and an article on a controversial new claim by Goodenough here.
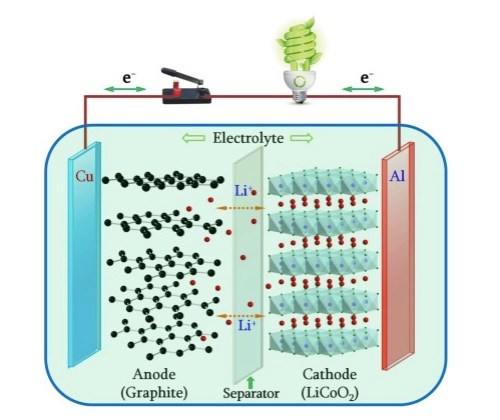
What Goodenough and his team managed to do was create a battery cathode stable enough to act as a source of lithium ions without collapsing in upon itself. This allowed a battery to be charged and discharged, yet hold its energy in-between. The team did this through experimenting with a variety of metal oxides until they came across a lithium-cobalt-oxide combination that provided power with stability. To complement this great leap forward in the cathode, progress was required in the anode, and that came in the mid-1980s through the work of Akira Yoshino in Japan.
Yoshino’s genius was to match graphite in the anode with Goodenough’s lithium-cobalt-oxide in the cathode. On top of the basic battery chemistry, Yoshino also pioneered a number of fabrication techniques that eventually took the lithium-ion battery out of the laboratory and into commercial production by the Sony Corporation. In short, the Goodenough-Yoshino insights produced a dramatic leap in deliverable power and energy storage.
Although the lithium-ion battery revolution of the 1980s ushered us into a world of ubiquitous mobile electronics, it was initially not sufficient to beget the transport and energy storage revolutions Tony Seba talks about in his presentations. Part of the problem here is that the battery makers face an optimisation problem with 6 variables. They need to look at all of the following:
Safety and maturity on the battery cell level
Power capability and charge/discharge characteristics
Energy contents of the battery cell
Cycling efficiency and self-discharge
Degradation and aging phenomena
Material and battery cell cost
The battery chemistry required is a perpetual trade off between these six. A push for power can compromise safety, and so on it goes. A second problem is that a battery is a multi-component mechanism. You have a cathode, an anode, an electrolyte and a separator. As you tweak the chemistry of one, it will have a tendency to produce unintended consequences in the chemistry of another.
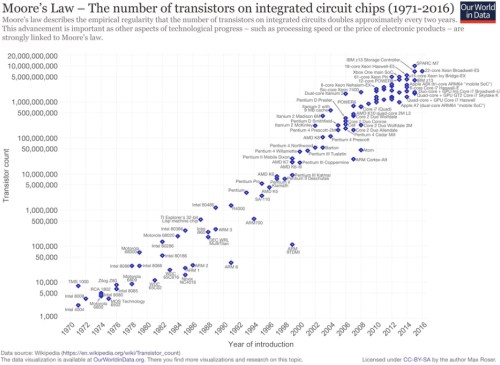
Finally, and perhaps most importantly, a battery is not subject to Moore’s Law: it is subject to Faraday’s First Law of Electrolysis. This states that the amount of current passed through an electrode is directly proportional to the amount of material liberated from it. In other words, there is a linear relationship between electrical current and material. You may be able to increase the amount of material liberated from an electrode through using a different kind of material, but what you can’t do is increase the electrical current with the same amount of material.
This is a very different relationship from that referenced in Moore’s Law (which is really an empirical observation not a physical law). I blogged on this same topic three years ago (here) and at the time referred to the original 1965 article by Gordon Moore that ushered in Moore’s Law entitled “Cramming more components onto integrated circuits.” In the original paper, Moore referred to a doubling of the number of transistors on an integrated circuit board every year, which he later modified to every two years. Either way, the only way you can display that kind of growth on a graph is through using a logarithmic scale as can be seen with what actually happened:
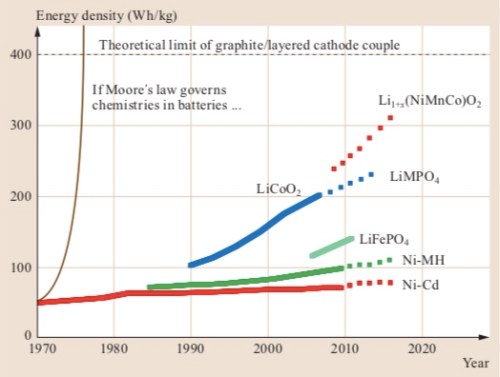
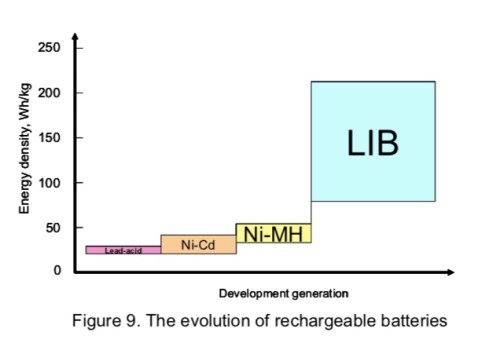
And let’s contrast and compare the Moore’s Law dynamic against battery advances (from here):
Nonetheless, you can see that considerable progress has been made. Note that the progression from Goodenough’s lithium-cobalt-oxide combination to a nickel-magnesium-cobolt-oxide combination is an advancement of the same type of chemistry, not a new technological leap. Interestingly, Goodenough himself is rather dismissive of such incremental moves, feeling that they won’t be sufficient to supplant the internal combustion engine. From the Steve LeVine interview:
The stakes are high, and Goodenough dismisses a lot of the competing approaches he sees—Tesla’s Elon Musk, for instance, who he says is content to “sell his cars to rich people in Hollywood” while waiting for scientists to create a battery that will power a middle-class electric car. That is not precisely fair—Musk is obviously selling his $80,000 to $100,000 cars to an elite niche, but by 2018 he vows to have a roughly $35,000 model for a broader slice of the market. He is getting there through agile engineering that has provided incremental improvements to his battery.
But Goodenough is equally dismissive of such tinkering and its measly 7% or 8% a year in added efficiency. “You need something that will give you a little bit of a step,” he says, “not an increment.”
Tony Seba, Ray Kurzweil and other assorted techno-cornucopians achieve almost instant doublings by assuming growth rates in the high teens or better. Unfortunately, much science progresses in the low to mid single digits, so change is measured in decades–not years.
The distinction is important. Under the Kurzweil logic, we don’t really need to tackle climate change or resource depletion because technology is on the case. Just go about your business as usual, tuck up your kids in bed at night, and scientific innovation will do the rest.
But unless Argonne Laboratory‘s battery guys and their peers step up the pace (which looks exceedingly difficult), electric vehicles will not replace conventional internal combustion engines for a couple of decades or more. That translates into no natural near-term carbon emission mitigation in the field of motor transport. And unless we get very lucky with climate sensitivity to CO2, that also means we will get a lot closer to exceedingly dangerous climate change.
It now appears that I (and Goodenough) could have been wrong: “such tinkering” has managed to deliver double-digit efficiency gains. These gains have, in turn, allowed Telsa to start tipping the market toward EVs at the luxury end with the Model S. And Elon Musk now appears to be doing the same with respect to more compact cars with the Model 3.
If Tesla keeps going into more and more segments (and drags the entire auto industry along with it), then through mitigating (but perhaps not eliminating) the risk of dangerous climate change, Musk, along with Goodenough and Yoshino, will have had more impact on the planet than any human being who has ever lived. We define the Anthropocene as the geological period over which human activity has had an appreciable impact on the environment and climate. Should Tony Seba’s transport and energy revolutions come to pass, it is extraordinary to think that the actions of Goodenough-Yoshino-Musk will have shaped how the Anthropocene unfolds.
I believe that Goodenough and Yoshino certainly deserve to be awarded the Nobel prize for chemistry. Further, should battery efficiency continue to progress at its current pace such that fossil fuels are removed from the transport and energy storage equation, then the role of all three in preventing dangerous climate change will have been immense. Indeed, I can’t think of any three more fitting recipients of the Nobel Peace Prize in such a situation.
Nonetheless, I have got a little ahead of myself in handing out Nobel prizes. While I am far more confident than three years ago that we are close to an EV tipping point, we are not quite there yet. So in my next post we need to dig still deeper into battery efficiency and cost to see whether battery technology can advance just that little bit further to push ICE technology to one side.
In my last post, I set the conditions that determine whether the auto market tips from internal combustion engine (ICE) vehicles to electric vehicles (EVs). EVs need to either match or exceed ICE vehicles with respect to every car ‘attribute’ at an equivalent cost. Then it’s game over for ICE vehicles.
The attributes of a car give a consumer happiness. That utility comes from a) the mobility a car provides, b) the aesthetic of the car (the pleasure the owner gets in owning the car that is not related to other people) and c) status-signally through displaying ownership of the car to other people (such status signalling is not restricted to investment bankers and their Ferraris; it also covers hippies in their Citroen 2CVs and Green Party members in their Nissan Leafs).
The purchase decisions of consumers are based on their current budgets and future budgets. Current budgets determines how much they are able to pay for cars and future budgets determine how much they can afford to run their cars (fuel, maintenance, depreciation).
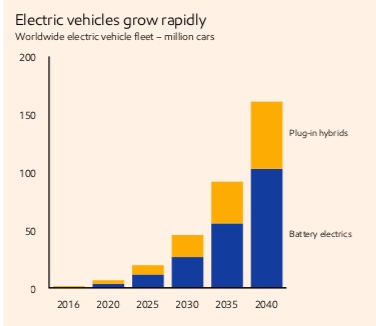
If EVs are better with respect to some of these aspects of the purchase decision but worse in others, then taking market share from ICE vehicles will be an uphill slog. That is what Exxon Mobile believes as illustrated in this chart from its latest “Outlook for Energy: 2018”:
If such a projection is correct, around 50 million EVs will be on the road (which includes pure battery and plug-in hybrids) in 2030. That compares with the Tony Seba S curve view of 130 million EV sales alone in that year.
To tease out who is likely to be right, let us think of the physical limits auto makers have to work with. Basically, a car is a three dimensional irregular cuboid shape constrained by such external factors as lane width and parking space size. Certain things are then put into this irregular cuboid shape to provide the mobility, aesthetic and status-signalling attributes we identified before.
Lots of car ‘stuff’ is not a function of whether it is an ICE vehicle or EV. For example, the headlights, wing mirrors, windscreen wipers and so on. We can exclude such items from our analysis since an EV can match the ICE vehicle in these domains. Moreover, there is no reason why an EV can’t match an ICE in terms of aesthetic or status-signalling should its design be good enough and its ability to fulfil the mobility criteria.
The main differentiator between an EV and ICE vehicle when it comes to mobility relates to the drivetrain. Taken, holistically, we can think of this as encompassing a store of energy and a means of converting that energy into motion. We can now compare EVs against ICE vehicles in respect of this broadly defined drivetrain across a series of factors, most importantly:
Weight
Volume
Efficiency
Flexibility
Given its position as the undoubted pacesetter in cutting edge EV design, performance and production numbers, Tesla’s Model 3 is a worthy champion for the EV camp. The standard Model 3 has a curb weight of 1,610 kg, while the extended range version is 1,730 kg. The crotchety Jack Rickard did a tear down of a wrecked extended-range Tesla Model 3 (warning: it is a long video) and extracted the battery, which weighed 478 kg. So that means the battery weighs roughly 28% of the car.
Let’s choose the BMW 330i Sedan as a typical ICE competitor for Tesla; its specifications taken from BMW’s USA site can be found here. This sedan comes in at 1,610 kg, so the Tesla is 7.5% heavier. Curb weight generally includes a full tank of fuel, which in the BMW’s case is 15.8 gallons or about 45 kg in weight (you can see here the extraordinary energy density of fossil fuels).
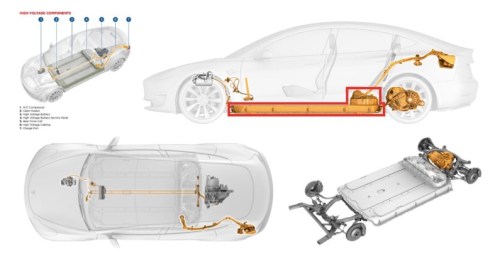
So that in a nutshell is the handicap of the battery as an energy source: more than 400 kg of extra weight. On the other side of the ledger is the fact that you wonder where the engine has gone in an EV. Here is the schematic for the Model 3:
First, you notice the radical shrinkage of the actual engine itself. An internal combustion engine is a system of controlled explosions that first translate into lateral movement of the pistons, which in turn has to be translated into circular movement to the wheels. That requires a complex multipart machine.
The video below compares and contrasts the Tesla drivetrain with a traditional ICE (but note it highlights the induction motor in the Model S; the Model 3 motor and electrical motors in other automakers EVs are somewhat different) and emphasises the fact that the electrical engine has radically fewer parts.
And here is a couple of minutes on the Model S engine showing its intrinsic simplicity:
The key differentiator, obviously, is the disappearance of a bunch of ICE components: transmission, exhaust system, fuel pump, fuel injection and spark plugs. An EV does need some kind of cooling system for both the motor and the battery, but this is relatively modest in both weight and volume.
Overall, if we take out the gas tank and the battery from the equation then we get this:
EV drivetrain weight < ICE drivetrain weight
EV drivetrain volume < ICE drivetrain volume
But through adding the battery and gas tank back in, these inequalities reverse:
EV drivetrain weight > ICE drivetrain weight
EV drivetrain volume > ICE drivetrain volume
Now, it’s very difficult to put numbers into these inequalities. But the interesting thing about Tesla’s Model 3 is that it incorporates a large battery in terms of kilowatt hours (kWh) but the car is still in the same ball park weight category as its ICE competitors. Moreover, we are currently going through a period of rapid battery cell shrinkage (weight and volume per kWh). Let’s say Tesla can shrink the 479kg battery that Jack Rickard extracted from the wrecked Model 3 by 25%; that would give a weight saving of 120kg. We are now getting into matching territory. And remember the conditions for tipping. EVs don’t need to exceed ICE vehicles for the market to tip: they just need to match in most areas and excel in a few.
Next we come to flexibility, which really relates to the configuration in our irregular cuboid. So yet again putting the battery to one side, the EV has an instant advantage. The drivetrain units can be arranged more flexibly as they are linked principally by wires, not by a complex transmission mechanism.
Even with the battery, the possibilities of dividing it up and distributing it around the car have yet to be explored. Safety and cooling issues not withstanding, the overall battery is cellular and is just composed of thousands of small batteries. We talk of form factors with mobile phones, and this is ultimately where we will move with cars. With an ICE, you have to design around the drivetrain, with an EV the drivetrain can become subservient to the design.
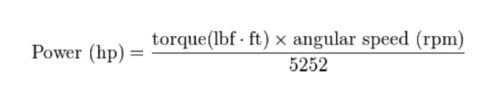
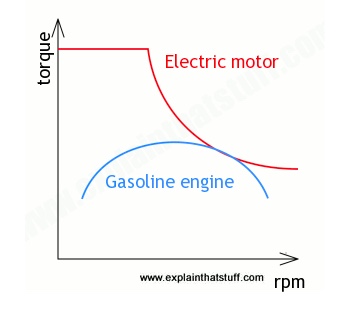
So then we move to efficiency, with respect to which the EV wins hands down. An electrical motor can deliver instant power and torque. In the US context with imperial units we have this equation.
Which translates into this chart:
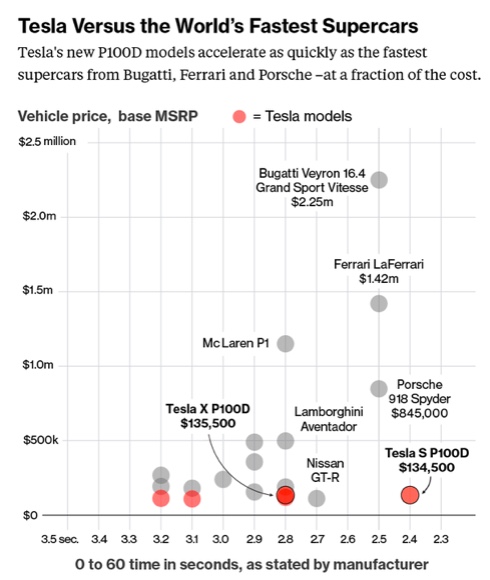
As a result of the dynamic in the above chart, Tesla is currently able to deliver supercar type performance at a fraction of the cost of the likes of Porsche, Bugatti or Ferrari (source: here). Note that Tesla’s new Roadster due to be released in 2020 will have a base model that delivers zero to 60 in 1.9 seconds; that will be the first production car ever to break two seconds.
Moreover, such high-end, halo EV performance profiles will trickle down. Ultimately, taking price to price comparisons, the EV will leave the ICE car in the dust when the stop light turns green. For those of a non-macho disposition, you may not care. But to repeat (again) if the EV is equal on all metrics but ahead on just one that you care about (all at an equivalent price), then you will buy the EV.
And yes we still have the constraint of range and price. And yet again this takes us back to the battery. Indeed, the EV battery is like the little Dutch boy Hans Brinker whose finger in the dyke is the only thing stopping the entire neighbourhood being flooded and his family and friends being drowned. But once the battery gets down to a price and efficiency point not far from now, that dike will go and the ICE industry with it. The battery is the subject of my next post.
“What makes us buy a car?” Well something obviously does since global sales of cars and light vehicles reached around 100 million a year in 2017. Moreover, if we can answer that first question then we are in a better position to answer this question: “What makes us choose an electric vehicle rather than an internal combustion engine (ICE) vehicle?”.
These questions come from the demand side. Up to now, all my posts have basically been dealing with the supply side. That is asking questions such as “Who will sell EVs?, “Who is investing in EV production?”, “Will there be enough lithium?”. My answers to those types of question leads me to believe that the supply side can keep us on Tony Seba’s EV penetration S-Curve through to at least the mid-2020s. But will anyone buy these EVs even if the auto makers build them?
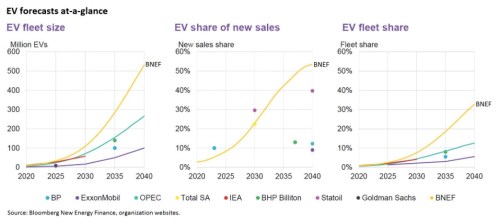
Hoping to shed some light on that question, I have been toiling over reports by companies and organisations that forecast how many vehicles will be sold in the future and what percentage of those vehicles will be EVs. In September 2017, David Roberts at Vox wrote a nice piece pulling all those forecasts together:
A reminder: I have taken Tony Seba’s death of ICE vehicles by 2030 forecast to mean 95% market penetration (130 million EV sales). From the middle chart above we can see what everybody else thinks:
Exxon Mobil: 10% by 2040
British Petroleum: 10% by 2023
Norway’s Statoil: 40% by 2040
Goldman Sachs: 9% by 2040
OPEC: 12% by 2040
Total SA: 22% by 2030
Bloomberg New Energy Finance (BNEF): 55% by 2030
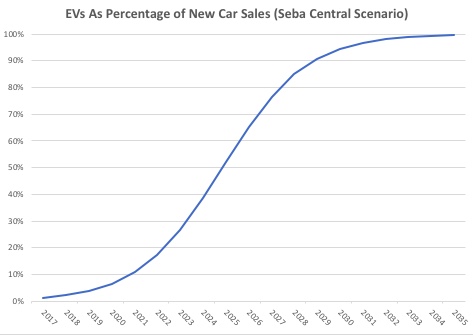
So they don’t agree with Tony. But my interest with them is less in the forecasts themselves (a topic for a future post), but rather how they were arrived at. Keep in mind that what I did in the chart below is not make a forecast but rather fit a few data points into a logistic function to produce an S curve:
To repeat, this is a data fitting exercise. I’ve just taken Tony Seba’s point forecast of 95% penetration by 2030, the current penetration and sales of EVs, and added an S curve that looks reasonably sensible. But it is not a true forecast.
There are a couple of ways to forecast: 1) you can create a model which is purely empirical and takes an historical time series and then projects it forward, or 2) you can build a microeconomic model in which your forecast variable is a function of variety of other variables. Hoping to learn what methods and methodologies these esteemed organisations and companies have been using to arrive at their EV penetration rates, I trawled through the back pages of their reports looking for references and helpful appendices, but there were none to be found (at least as far as I could find; I am still working my way through these reports).
I get the distinct impression that the forecasts drop down like manna from heaven. It’s basically a game of pick a number that looks roughly right based on your organisation’s attitude toward EVs and then construct a vague argument surrounding that forecast number. You could argue, perhaps, that it is impossible to do anything more rigorous given the profusion of variables that come into the purchase decision, stretching from GDP growth rates and the oil price at the macro level to eco fashion and periodic EV safety scares at the micro level. But I still think we can do better than that, by adopting a somewhat different approach.
From the existing academic literature based around ICE purchase decisions, we know that consumers have a fixed budget and are presented with a basket of goods that they can spend the budget on (or save). You can consider that basket of goods as consisting of cars and non-car goods. A consumer will buy a car rather than the alternative of non-car goods if the car gives him or her a higher degree of utility (happiness or pleasure). The sources of utility derived from a car can be thought of as threefold:
Mobility
Aesthetic
Status signalling
So cars aren’t just a means of transport: they are also like large pieces of jewellery which give one pleasure through personal contemplation of them and through displaying them to other people.
Finally, the budget constraint is temporal: it stretches from the present to the future. So the purchase decision is not just bounded by the current available budget but also budgets through time. Accordingly, the purchase decision takes into account future costs captured by
Fuel
Maintenance
Depreciation and replacement
This is all pretty much common sense even if I have used economic terms, which may be unfamiliar for some. But I hope we can pull out some insights that will impact on EV adoption rates. The next bit is important: I don’t have to build a complicated multivariable model and input millions of data points into a computer to derive some insights. From basic theory, I know how the model will act in certain conditions. Let’s look at one such set of conditions.
First, we start with a budget constraint existing now in an ICE dominated world. Consumers have allotted to spend an amount of money now and in the future on a means of mobility whether EVs exist or not. This is where it gets interesting and why I feel the adoption forecasts by the likes of Exxon Mobile and the International Energy Agency make no sense whatsoever.
If any individual consumer is faced with an EV that is a) cheaper than an ICE, b) has lower ongoing costs than the ICE, c) has better mobility characteristics than the ICE, d) is prettier than the ICE and e) signals status better than the ICE, then that consumer will always choose the EV. That is because the consumer will get a higher level of utility from the EV purchase. (Alternatively, the consumer will spend less money buying an EV yet get the same amount of utility as buying the ICE, so then having extra money to spend on non-car goods.)
In fact, I can even relax these conditions a bit. Let all the factors be equal except one where the EV is better. That market will also flip 100% EV too. Don’t believe a market can do that? Look what happened with film and digital cameras.
I admit to some brakes on the transition: the consumer has to be aware of how the variables have changed in EV’s favour. That requires active information searches or exposure to information through advertising and marketing. The psychology and marketing literature covers that aspect of decision-making well.
Moreover, a more important reason why markets don’t flip overnight (ignoring the supply side) is because they go through an intermediate phase where some of the factors differentiating between products are positive and some negative. And given that consumers derive different utilities from each factor, the market will move in phases from one state to another as each individual faces a different decision-making process.
For example, purchasers of the first Tesla model S were deriving most of their utility through signalling that they a) were an early adopter of new technology and so were hip, b) had superior eco credentials and c) had immense wealth since they could afford the car. The rest of the population didn’t have the budget to buy the car and/or was less interested in the status signalling or, maybe, just didn’t like the look of the car. So the market didn’t tip the first day the Model S went on sale.
This brings me to why I think consensus forecasts for EV penetration are barking mad. As of 2018, EVs have already exceeded ICE vehicles with respect to a number of the variables. They pose less of a future budget constraint because they a) are cheaper to run, b) have lower maintenance costs and c) have a longer potential road life as they have fewer parts to wear out.
So we are left with the upfront price of an EV versus an ICE (which is the current budget constraint), the mobility functions, aesthetic and status signalling.
For EVs, nearly all of these factors relate to the size and cost of the battery pack. If the battery pack price can come down enough, the drive mechanism of an EV will be cheaper than an ICE, which means the overall vehicle will be cheaper. Note that engine power delivered by a battery is already better for an EV than an ICE. If the energy density of batteries improves enough, then the mobility characteristics such as range of the EV will be able to at least match the ICE. If the battery pack shrinks enough, this will improve mobility characteristics such a storage and opens up a range of new form factor possibilities that impact aesthetics.
There is one aspect of the aesthetic that I think an EV can’t match; that is, the joy brought to some people through owning a piece of precision engineering. A high end ICE is a marvel of engineering and an ICE engine has an aesthetic all of its own. The residual ICE market for me will be cars as luxury watches. Rolex, Tag Heuer, IWC, Breitling and Breguet of Switzerland still sell mechanical time pieces, but their market share is tiny. That to me is the fate of the ICE due to the cold, hard logic of the EV surpassing the ICE on every other variable that goes into a consumer decision-making process.
So the battery holds the key. That will be the subject of a future post.
In my last post, I suggested that we “follow the money” and see how much money is pouring into lithium mining projects. That post concentrated on the Big Three incumbent lithium miners whose operations are centred around extracting lithium brine from the salt flats and lakes of Chile and Argentina.
In this post, I want to look at the new entrants to the lithium mining market. Through doing so, I believe you can get a sense of the fever pitch activity in this space. And the lithium production ramp-up will need to stay at a fever pitch for the next decade for Tony Seba‘s predictions to come true. To repeat, he states that electric vehicles (EVs) will make internal combustion engine (ICE) vehicles near extinct by the year 2030 (and, in so doing, this will trigger an extraordinary social and geopolitical transformation).
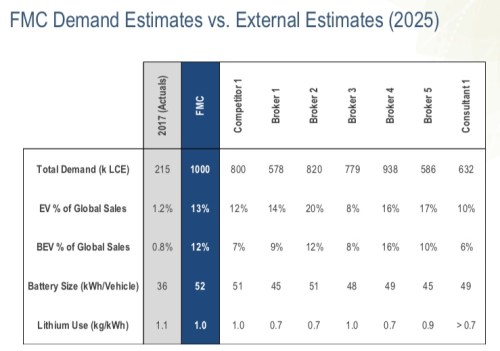
But before so doing, I want to again provide context. A web article headline saying that company X aims to produce Y amount of lithium has no meaning if we can’t translate that into EVs on the road. Hence, let us repeat this chart from my last post by one of the Big Three incumbent lithium miners FMC:
I’m going to pluck out three very useful numbers from this presentation. First, total demand for lithium carbonate equivalent (see my post here for how that differs from lithium metal) was 215,000 tonnes in 2017. Second, FMC and most observers believe that the average EV sold in 2025 will have a battery size of 50 kilowatt hours (kWh). Third, around 1 kilogram (kg) of lithium is required per 1 kWh of battery cell. Since there are 1,000 kgs in a tonne, 215,000 tonnes of LCE translates into 21.5 million kgs of LCE. If each EV uses 50 kgs of LCE, then by dividing our 21.5 million kgs by 50 gives us 4.3 million EVs.
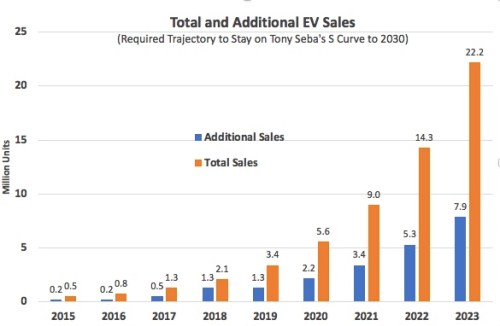
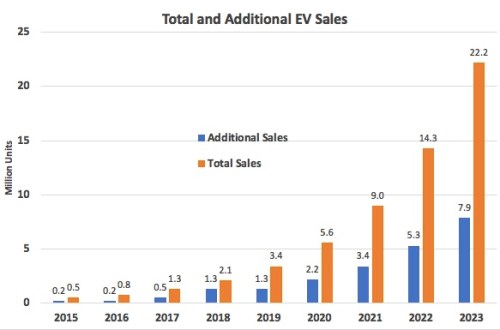
Now we have some context: if we allocated all our current lithium production capacity to EVs, we could produce 4.3 million of them. But to stay on Tony Seba‘s S curve we need to produce 22 million EVs in 2023 in order to have a chance of hitting 130 million EVs in 2030. So we need to find a lot more lithium.
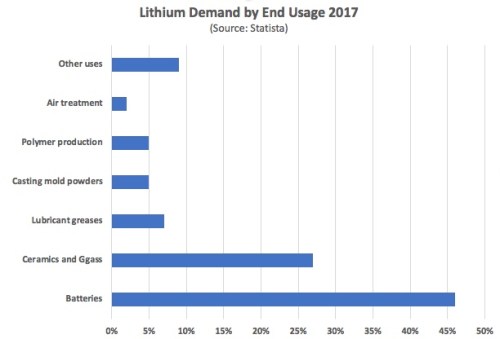
Tougher still, the majority of existing production is being accounted for by uses that don’t relate to batteries:
And of the battery usage, the vast majority of lithium goes into consumer electronics rather than EVs (from a paper by Sun et al).
That chart is based on 2016 numbers, so in terms of lithium-ion batteries alone, we likely were around one third lithium for EVs, one third for phones and one third for portable computers in 2017. Accordingly, since lithium-ion batteries make up 45% of overall lithium demand, and EVs make up one third of lithium-ion battery demand, then EVs account for around 15% of overall lithium demand at the current time.
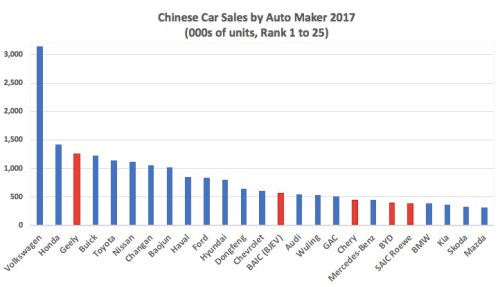
Given LCE production of 215,000 tonnes in 2017, this suggests 32,250 tonnes ended up in EVs. Dividing that by 50kg per car would get us on 645,000 EVs compared with actual sales of around 1.3 million. However, the EV market is still dominated by plug-in hybrid vehicles (PHEVs) and city EVs, both with very small batteries. The best selling 2017 EV in China, for example, was the BAIC EC80 with a 22kWh battery pack. So the numbers look about right.
To put 22 million new EVs on the road in 2023 with 50 kWh of battery per vehicle, however, would require 1,100,000 tonnes of LCE going into EVs as compared with 32,250 tonnes today. Is that possible?
In my last post, I stated that the Big Three incumbent lithium producers (SQM, Albemarle and FMC) were intending to increase LCE production from 125,000 tonnes to 485,000 tonnes over a timescale toward 2023. That’s an increase of 360,000 tonnes of LCE. Add on existing LCE production earmarked for EVs (32,500) and that gives us a total of 392,500 tonnes of LCE. But our need is north of 1,000,000. Can we get there?
Hard Rock Drives Lithium Growth
The mining of hard rock spodumene ore is where the real action is taking place in terms of capacity expansion, with Australian miners at the front of the pack. Nonetheless, tucked in behind the Aussies and a couple of years behind are a plethora of projects being advanced across the globe.
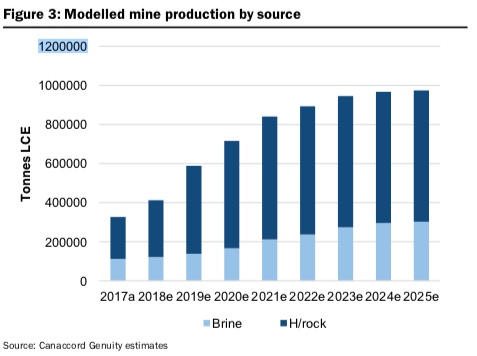
Generally, the investment community has been behind the curve in terms of forecasting lithium production hikes, but each new report pushes projections higher. The Canadian broker Canaccord Genuity in a report released in April 2018 sees a ramp up to over 900,000 tonnes of LCE in 2023. And given we are seeing funding announcements every day for new mines, I think it will be relatively easy to push that number above the 1 million tonnes mark. From the chart below you can see that the big gains are coming from hard rock, not brine operations.
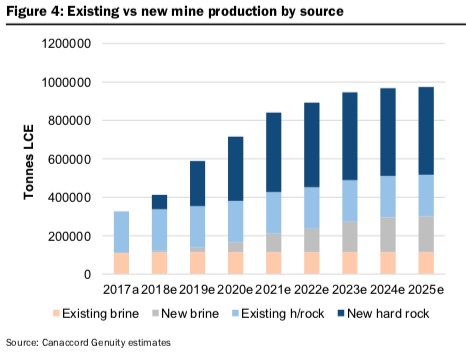
The increase in hard rock supply is coming from both the expansion of existing mines and the introduction of new ones:
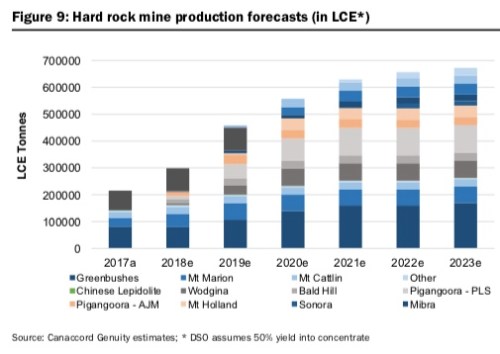
In the chart below, the production jumps for hard rock are broken down by mine. Importantly, of the mines listed, Greenbushes, Mt Marion, Mt Cattlin, Bald Hill and the two Pigangoora mines are all located in Australia and now in production. Further, Mt Holland and Wodgina, also in Australia, are fully funded and in the development stage. Let’s look at them more closely.
Talison Lithium (Greenbushes Mine, Australia): Talisan Lithium has been the role model for other Australian hard rock lithium projects due to the success of its Greenbrushes mine. The company is a joint venture between Tianqi Lithium of China and the US firm Albemarle. The current capacity of the mine is 80,000 tonnes of LCE, making it the largest single source of lithium in the world, but the firm has announced plans to double its capacity to 160,000 tonnes.
Neometals/Mineral Resources/Ganfeng Lithium (Mount Marion Mine, Australia): Mount Marion is a joint venture between the three partners: Neometals (13.8%), Mineral Resources (43.1%) and Ganfeng Lithium (43.1%). Stage 1 of the mine plan was complied in 2017, with the ability to produced 25,000 tonnes of LCE a year. After further ramp-ups, the joint venture is targeting production of 450,000 tonnes of 6% spodumene, which translates into 145,000 tonnes of LCE.
Galaxy Resources (Mount Cattlin, Australia): The Mount Cattlin hard rock lithium mine ramped up smoothly in 2017 to reach a run-rate of 19,500 tonnes of LCE by year end. In May 2018, the Korean steel company POSCO, which is also a leader in battery materials, paid Galaxy $280 million for rights to the Salar de Hombre Muerto brine concessions in Argentina. Galaxy will, in turn, use the capital to fast track another new brine project Sal de Vida in Argentina and a hard rock project James Bay in Quebec.
Pilbara Minerals (Pilgangoora):Pilbara’s mine will commence producing concentrate from June 2018. In Stage 1, the company is targeting 43,000 tonnes of LCE, rising to 100,000 tonnes after Stage 2 is completed. It has already signed off-take agreements with General Lithium, Ganfeng, Great Wall Motors and POSCO of Korea,
Altura Mining (Pilgangoora):Altura is just commencing operations and aims in Stage 1 to reach production of 30,000 tonnes of LCE. Stage 2 will double the LCE output. Off-take partners are Optimum Nano and Lion Energy.
Tawana/Alliance Mineral Assets (Bald Hill): The mine went into commercial production in April 2018 and is targeting around 20,000 tonnes of LCE with a stage 2 and 3 ramp-up also planned.
Mineral Resources (Wodgina Mine, Australia): The Wodgina project is the world’s largest hard rock lithium deposit. Mineral Resources (MRC) aims to produce 750,000 tonnes of spodumene 6% once the mine reaches full production in future, which is 240,000 LCE, or equivalent to the world’s current production. MRC is looking to sell off a 49% minority stake in Wodgina. It will be fascinating to see who will step up to buy this stake, one of the largest, highest quality lithium assets in the world up for auction..
Kidman Resources/SQM (Mount Holland Australia): The Earl Grey Project at Mount Holland is a 50:50 joint venture between Kidman Resources and one of the Big Three lithium miners SQM, with a resource of 7 million tonnes of LCE and an eventual annual production of 40,000 tonnes of LCE and is planned to come on stream in 2021.The JV is planning to be an integrated operation, with the principal end project being lithium hydroxide. Tesla has already entered into an off-take agreement to take a large part of the plant’s output.
Outside of Australia, the pace of development had been slower, but then in the first few months of 2018 activity suddenly accelerated, with important announcements surrounding two large Canadian mining projects.
North American Lithium (Abititi, Quebec, Canada):In March 2018, the Chinese battery manufacturing CATL took a 90% controlling stake in North American Lithium. CATL‘s battery factory expansion plans will make it into the largest battery manufacturer in the world and it wants to nail down guaranteed lithium supply. The first stage of the Abitibi project will see production of 23,000 tonnes of lithium. Prior to the CATL takeover, the company was hoping to raise $425 million with a tentative production of 25,000 tonnes of LCE scheduled for 2020. Given the delays prior to CATL’s move, that date for commercial production would appear to be a stretch goal, but the financing now appears in the bag.
Nemaska Lithium (Whabouchi, Quebec, Canada): The Whabouchi project, like the one at Abititi, appeared to be stuck at the financing stage for the last few years, but then everything changed with three quick-step developments. First, the company announced a US$350 million bond offering in April 2018 that was fully subscribed. Almost simultaneously, the Japanese tech giant Softbank bought a 10% stake in Nemaska for C$100 million. Then in May 2018, Nemaska came back to the market with a C$360 million stock offering, which again was placed easily. These moves, together with a $150 million streaming agreement with Orion (under which it sells a future stream of its lithium production for an upfront lump sum payment), mean Nemaska secured a C$1.1 billion financing package in the space of a few months. The company is now looking to reach commercial production in the second half of 2020, with an initial aim of producing 32,000 tonnes of LCE a year. It has already secured agreements to sell the lithium it produces to a large new battery manufacturer starting up in Europe: Northvolt.
If you think hard rock activity is restricted to Australia and Canada, here is a list of other projects that are progressing, albeit a little behind the Aussies and the Canadians:
Rio Tinto (Jadar, Serbia)
Birimian (Goulamina, Mali)
AMG (Mibra, Brazil)
Bacanora (Sonora, Mexico)
Prospect (Arcadia, Zimbabwe)
Piedmont (North Carolina, USA)
Lepidico (Alvarroes, Portugal)
Novo Litio (Lucidakota, Portugal)
There are a lot more projects out there, but that’s enough for now on lithium projects.
Finally, some thoughts on the scale of the ramp-up in lithium mine production. Projects either recently put in place, starting up now, or planned are raising total global lithium production capacity five fold from a little over 200,000 tonnes of LCE in 2017 to likely over one million tonnes in the early 2020s.
That kind of production hike costs an awful lot of money, but the money has been secured. In other words, a lot of smart people believe the market will be able to absorb over one million tonnes of LCE within five years. If they are wrong, the price of lithium will collapse and these projects will founder and those same people will lose an awful lot of money.
Bottom line: to not lose money those financiers are betting the market can absorb a five-fold hike in lithium production. And the only way that will happen is if EV production and sales rise almost 20-fold from their current levels. And a 20-fold rise in EV sales will keep us broadly in line with Tony Seba‘s S curve through to the early 2020s. So a lot of big money believes in Tony‘s vision (even though most players don’t realize they do).
Of course, to get to Tony Seba‘s ultimate forecast of 130 million EV sales in 2030 would require lithium production to not only jump five-fold between now and say 2022, but also then jump six fold again through to 2030. Five times six equals 30. That is a lot of lithium! But a thirty-fold jump in lithium demand also means an awful lot of money to be made. In sum, Tony Seba‘s vision rests on a mountain of lithium. To grasp whether that mountain will grow big enough, just listen to Deep Throat‘s advice:
In my last post, I focused on the dynamic nature of lithium reserves and resources and the fact that as demand for lithium shoots up, the demand side shouts out to the supply-side to get its act together through the price mechanism. Accordingly, there is no fixed cake of lithium. We don’t just eat one fixed lithium cake in front of us until it has all gone.
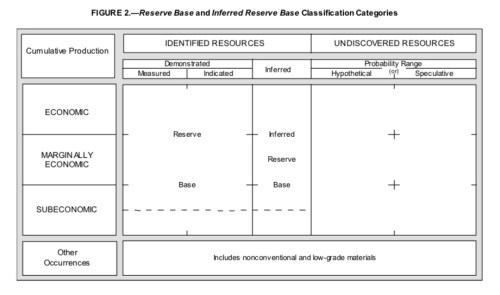
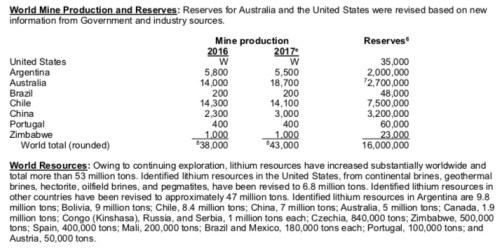
The authoritative United States Geological Survey in its latest round-up of the world’s metals and minerals says we have 53 million tonnes of lithium resources available to be exploited as of 2017, compared with 13 million tonnes in 2005. As the table below shows, however, recorded resources do not include unconventional sources, sources that are too low grade (not concentrated enough) or undiscovered resources. The vast majority of lithium within the earth’s crust is either inaccessible deep below ground, at the bottom of the sea, or far too expensive to extract due to its diffuse nature.
Yet that leaves a bunch of lithium that is perfectly usable but remains undiscovered. How much? Who knows. We can get some sense of what is out there by looking at the annual flow of lithium from ‘undiscovered’ to ‘identified’, and (with my economist’s hat on again) seeing how much money is being expended to help that process along.
If you read each year’s edition of the USGS’ Mineral Commodity Summaries, you do get some sense of annual tends, but the USGS doesn’t look forward into the future. For that, we need to listen to “Deep Throat”s advice to Bob Woodward (played by Robert Redford) in “All the President’s Men”. That advice was “Just, follow the money”.
And it was through “following the money” that it suddenly dawned on me that perhaps Tony Seba’s predictions were not so crazed as I had orginally thought four years ago. Now let us see how much money is going into lithium mining expansion and, even more interestingly, where it is coming from.
But before we start, let me give you a bit of context. In my last post, I referred to the assumption by ‘peak lithium’ advocate William Tahil that one kilowatt hour (kWh)’s worth of EV battery storage required 1.4 kilogram (kg) of lithium carbonate equivalent (LCE). More modern estimates are closer to 1kg per 1kWh, which thankfully makes the maths a bit easier too. New generation EVs with a decent range have around 75kWh-sized batteries. From this, we can calculate that to produce one million good specification EVs you need 75 million kgs of LCE, or 75,000 tonnes. Also, keep that lithium carbonate equivalent (LCE) abbreviation in mind, we are going to use it a lot!
The Big Three (SQM, Albermarle and FMC)
Perhaps, we can divide our time line between the ‘Electric Vehicle Era” (EVE) and the “Before Electric Vehicle Era’ (BEVE). Once upon a time in the BEVE there lived three happy oligarchical lithium producers who carved up the market amongst themselves. Because they had access to a relatively cheap source of lithium extracted from brine lakes, no other entrant could enter the market without making a loss.
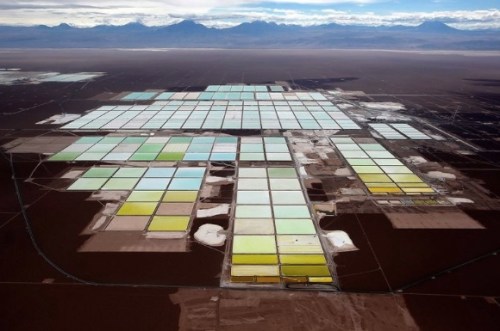
What is brine in this context? Water with super concentrated amounts of minerals that can include lithium. Due to its higher density, it sinks to the bottom of ordinary bodies of water. The Big Three operators have their core base in the lithium triangle of Chile-Argentina-Bolivia. They pump brine out into evaporation pools and then let the sun remove the water, leaving a mineral sludge. And for your added edification, here is a video of an eel having an unfortunate encounter with a deep sea brine lake as narrated by David Attenborough in Blue Planet 2:
And for a seriously sized evaporation pond, look at this one belonging to SQM:
Sociedad Química y Minera de Chile (SQM)
One of the biggest of the oligarchs is SQM, which in 2017 had revenues of $2.2 billion, a third of which come from lithium. The company’s web site is here. The company has a somewhat murky pedigree, with the son-in-law of former strongman and ruler of Chile General Pinochet being a key shareholder.
The company is allowed by the government of Chile to extract 350,000 tonnes of lithium metal from one of the largest brine lakes in the world called the Salar de Atacama. This lithium budget is good until 2030 under an agreement reached in January 2018 following a very fractious round of negotiations. Chilean lithium companies have to broker agreements with CORFO, the Chilean government entity that licenses extraction rights to Chile’s lithium resources in exchange for royalties. The new deal translates into 2.2 million tonnes of lithium carbonate equivalent (LCE, see my last post for an explanation of contained lithium metal and lithium carbonate equivalent).
In 2017, SQM produced 48,000 tonnes of lithium carbonate and 6,000 tonnes of lithium hydroxide, which amounted to 23% of world supply according to them.
Under the agreement with CORFO, these numbers will rise to 100,000 and 13,500, respectively over the next two years, and could in aggregate rise again to 180,000 per annum while staying within the extraction budget set by CORFO through to 2030. Simplistically, that equates to about 2.5 million decent specification EVs worth of lithium, assuming that SQM suddenly stopped supplying lithium for any other end use. In reality battery quality LCE needs a certain level of purity that other applications don’t necessarily need. But we will keep hold of this quick and dirty equivalence; that is, 75,000 tonnes of LCE equates to one million EVs.
SQM also have a number of joint ventures in other countries, but they are not yet at the stage of producing lithium. We will come back to that.
Albemarle
The US-stock market listed Albemarle (web site here) is also active in Chile with operations at the same brine lake as SQM, the massive Salar de Atacama. In addition, it has a much smaller brine operation in Clayon Valley, USA, together with a bigger hard rock joint venture at Greenbushes Australia (49% Albemarle, 51% Tianqi Lithium of China). In 2017, the company produced 65,000 tonnes of LCE, which it plans to raise to 165,000 in 2021 and 265,000 sometime thereafter.
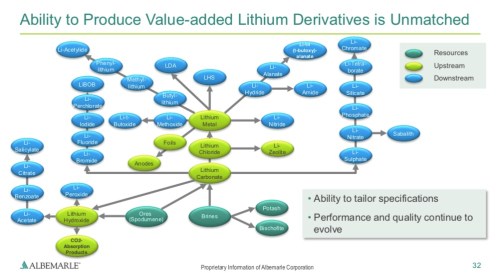
The company has considerable downstream processing capabilities, added to after purchasing Jianxi Jiangli New Material in 2016. As a reminder, lithium brines and lithium ores (spodumene) are at the top of the lithium supply chain, and from these feedstocks various processing stages take place in order to obtain a variety of useful lithium-based products. For battery production, the most important of such intermediate materials are lithium carbonate and lithium hydroxide. An Albemarle slides gives you a sense of the complexity:
With so much lithium in Chile being produced by SQM and Albemarle, battery component and module makers have been drawn to the country like a dog to a pool of sick.
The Chilean government has a development strategy based around capturing more of the lithium value chain in-country by, in effect, guaranteeing supply to only those processing companies that promise to set up lithium plants in Chile. So far, COMFO has indicated that 25% of Chile’s production (basically 25% of SQM and Albemarle‘s Chile production) will be preferentially allocated to Chilean-based processing plants.
Currently, the following companies are proposing in-country operations in exchange for guaranteed lithium supply:
TVEL Fuel Company of Rosatom of Russia.
Suchuam Fulin Industrial Group Co. Ltd of China.
Shenzheng Matel Tech. Co. Ltd. and Jiangmen Kanhoo Industry Co. Ltd. of China.
Molymet from Chile.
Gansu Daxiang Energy Thecnology Co. Ltd. of China.
SAMSUNG SDI Co. Ltd. and POSCO of Korea.
So we can see a host of battery component makers desperate to nail down their lithium supply, and they are happy to spend a lot of money setting up processing plants in Chile to achieve such an aim.
FMC
FMC (web site here) started out in life as the US-goverment founded Lithium Corporation of America, which was purchased by the New York Stock Exchange-listed FMC in the late 1980s. In 2017, the company produced 18,500 tonnes of LCE from its brine operations based in Argentina at the wonderful sounding Salar del Hombre Muerto. It aims to raise output to 21,000 tonnes in 2018, 31,000 tonnes in 2020 and 41,000 tonnes in 2022.
FMC has a wide range of chemical business and lithium only makes up less than 10% of revenue. Since lithium is viewed as a growth area, the company intends to spin out its lithium segment in an IPO in the autumn of 2018 as it believes a separate listing will get a premium stock market valuation.
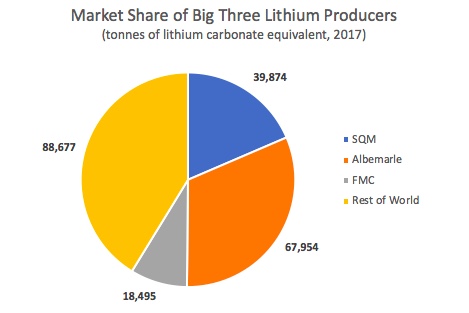
Big Three Signal Capital Intentions
LCE production in 2017 was around 215,000 tonnes according to FMC. From the company presentations of the Big Three, we can therefore work out market shares.
From the expansion plans published by the Big Three, we also know that they intend to increase LCE production from 125,000 tonnes in 2017 to 485,000 tonnes sometime after the year 2022. That is almost a fourfold increase. If we take that growth rate and apply it to the entire world, we should expect to see global LCE production of around 825,000 tonnes in and around 2023. That is a useful date, as it allows me to recycle this chart, which I haven’t done for a while:
At the top of the post, I said my ranging shot for LCE to EVs was this equality: 1 million EVs = 75,000 tonnes of LCE. My lithium production extrapolation above has us producing 825,000 tonnes of LCE around 2023. This amount of lithium could outfit about 11 million EVs in 2023: not enough for us to keep on Tony’s S curve. Of course, this assumes that the entire global lithium supply is dedicated to EVs (no more iPhones).
Therefore, the numbers don’t add up. To get them to match we need to alter things around. We have four choices: 1) don’t make so many EVs, 2) change the size of the batteries, 3) use less lithium by changing battery chemistry or 3) mine more lithium.
Let’s take a slide out of FMC‘s presentation to the Barclays Electronics Chemicals Conference May 14, 2018 (find the presentation here):
There are a lot of interesting things we can pull out from this. First, the most bullish broker has 938,000 tonnes of LCE being produced in 2025. That would be in line with my extrapolation. Second, there is a general consensus that average battery size will be 50kWh. If true, that gives us 50% more EVs per million tonnes of lithium than I had, getting my ranging shot estimate of EV sales numbers up to 16 million. That is close to where we need to be on Tony Seba’s S curve. Moreover, that same broker is only using 0.7kg of LCE per kWh. I think that is too ambitious, but we will come back to that when we delve more into battery chemistry.
Overall, the supply response from the lithium miners looks pretty good from the chart above. But is it good enough? At the beginning of the post I invited you to “follow the money”. We can see the Big Three intend to quadruple production over the next few years and that takes a lot of money. But the Big Three are doing the investment internally. To really see the tidal wave of new money coming into the sector you need to look outside of the Big Three. Moreover, for me, this wave of money suggests we could get to well above 1 million tonnes of LCE by the year 2025. That will be the subject of my next post.
We’ve spent a good few posts looking at the down-stream situation with respect to potential EV manufacture by the major auto makers. Now let’s climb all the way back upstream to the beginning of the supply chain in order to look at the battery metal miners.
I will start right off by saying that in a lot of my blog posts over the years I have been sympathetic to those who worry about resource constraints. Techno optimists and Dr Pangloss libertarians point to the explosion in material wealth over the last 200 odds years with not a serious, prolonged resource constraint in sight. Yes, we have had temporary issues with oil around the Arab oil embargo in 1973 and the fall of the Shah of Iran in 1979, but they have been short lived.
Part of my argument against such unconstrained optimism is that just because we have a 200-year data set with no resource constraints, that doesn’t mean you should be overconfident projecting that situation into the future. A centenarian can boast of an empirical record of having lived for 36,500 days. If we forecast that record forward, does that give him or her a better future life expectancy than a 10-year old?
If I were to volunteer to bat for ‘Team Resource Constraint’ against “Team Techno Optimists’, however, it would not be on the availability of lithium.
The first person to get major media attention over the potential for a lithium deficit was William Tahil when he posted a paper online in 2006 called “The Trouble with Lithium“, with a follow-up in early 2007 here. In the Executive Summary, he argued the following:
“Analysis of Lithium’s geological resource base shows that there is insufficient Lithium available in the Earth’s crust to sustain Electric Vehicle manufacture in the volumes required (my note: he means to replace internal combustion engine vehicles), based solely on LiIon batteries. Depletion rates would exceed current oil depletion rates and switch dependency from one diminishing resource to another. Concentration of supply would create new geopolitical tensions, not reduce them.”
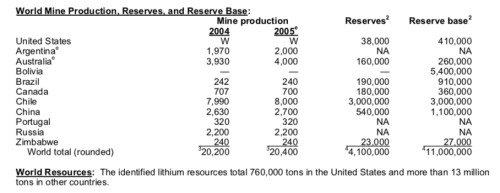
Tahil’s analysis started where any such work would start today: by looking at the reserves and resources for lithium as reported by the authoritative US-government agency the United States Geological Survey (USGS). Every year, the USGS publishes a report titled “Mineral Commodity Summaries”, which looks at the reserve and resource availability of 84 minerals and metals (from abrasives, aluminium and antimony to zeolites, zinc and zirconium) across more than 180 countries. The latest edition dated January 2018 is available here. You can also find the 2006 edition on the internet, which reports lithium reserves, reserve base and resources as of 2005. So this is the table Tahil would have had in front of him when he wrote his report:
According to USGS, 4.1 million tonnes of lithium reserves were available worldwide in 2005, 11 million tonnes of reserve base and 13 million tonnes of resources. The terms ‘reserve’, ‘reserve base’ and ‘resource’ are very important to understand. The term ‘resource’ is the widest and is defined by USGS this way:
“A concentration of naturally occurring solid, liquid, or gaseous material in or on the Earth’s crust in such form and amount that economic extraction of a commodity from the concentration is currently or potentially feasible.”
Note the wording “potentially feasible”. The reason why it is “potentially feasible” rather than “currently feasible” could be for three main reasons:
The technology is currently not available to extract the metal or mineral but feasible technology is in existance.
It is too expensive to extract the metal or mineral.
The metal or mineral price is too low to allow a profit to be made extracting the metal or mineral.
Nonetheless, the word “potential” requires a judgement call. It does not include minerals or metals that could be extracted with a technology that is from the realm of science fiction. Similarly, the future price may be taken to be higher than the current price, but not significantly higher. Thus, no metal from mining on the moon makes it into the USGS’s resource or reserve base, even though it is feasible that at some distant day in the future we could put a mine up there. The definition of “reserve” is a lot narrower:
“That part of the reserve base which could be economically extracted or produced at the time of determination. The term reserves need not signify that extraction facilities are in place and operative.”
So here we are talking about metal or minerals that we know about and could be extracted profitably now; that is, at the current metal or mineral price, with the current mine and milling cost structure, and with current technology. Resources are a very slightly wider definition of the reserve base.
To get a sense of how these definitions mesh together, the USGS puts out this helpful table:
The table is particularly interesting in that it shows us what doesn’t make it into the resource base. First, the bottom row labelled “other occurrences”. This includes “unconventional” reserves, which relates to reserves that can’t be extracted with any current technology that we aware of, although new technology could emerge (think of fracking of natural gas and oil). It also includes “low grade” resources. Many metals and minerals are found in minute quantities over vast areas but are impossible to extract economically.
Second, we have “undiscovered” resources in the right-hand column. Despite major advances in satellite, gravimetric, magnetic and seismic mapping, the majority of exploration is still old school. That means looking at the nature of surface geological formations and river sediments, or employing geochemistry techniques and soil sampling. From there, you move on to targeted exploration drilling. All this requires boots on the ground and costs money. So when the price of a metal goes up, more boots hit the ground and you get a migration of resources from “undiscovered” to “identified”.
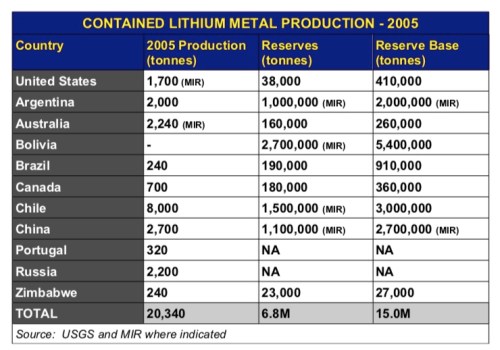
Now let’s go back to Tahil’s report. His firm, Meridian International Resources (MIR), came up with lithium reserves of 6.8 million tonnes and a reserve base of 15 million tonnes, somewhat larger than those of the USGS. This is because they identified reserves that USGS had not included.
Note also the wording “contained metal”. Since lithium can exist in nature in different metal compounds and ores, both the USGS and Tahil keep count of lithium reserves via contained lithium metal so as to compare apples with apples, not apples with pears.
Using ‘contained metal’ as the unit of account, however, is just one approach. Another, is to use the unit ‘lithium carbonate equivalent’, or LCE for short. Lithium carbonate is used in a range of applications, particularly the manufacture of lithium-ion batteries. In general, pure lithium is of little use by itself since it is so inflammable as you can see here:
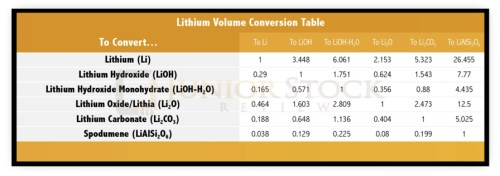
One tonne of the widely traded lithium carbonate only contains 0.188 tonnes of lithium metal. Likewise, if you had one tonne of lithium metal, you could theotetically produce 5.323 tonnes of lithium carbonate. To make things more complicated, there are other useful compounds of lithium on the market, such as lithium hydroxide, that contain more or less lithium metal. Moreover, the most common form of hard rock lithium, spodumene, contains a different amount still. A useful conversion table for the most common forms of lithium is given below:
Experts in lithium are at ease switching between these different forms, and Tahil changes from talking about contained lithium metal when referencing reserves to talking about lithium carbonate when assessing the needed supply for battery production. Journalists? Not so good at doing this. Consequently, you frequently see a journalistic treatment of lithium availability becoming hopelessly confused, since the writer in question has got into a complete muddle with respect to his or her unit of lithium account. This detour into lithium convertibility is important otherwise we wouldn’t be able to follow the rest of Tahil’s argument, which goes like this.
Tahil starts with a lithium reserve base figure of 15 million tonnes. However, he goes on to state that only part of that can be used in the production of lithium-ion batteries.
Only Lithium from the Brine Lakes and Salt Pans will ever be usable to manufacture batteries: the Spodumene deposits can play no part in this….
….Looking back at the table, we can optimistically estimate the Global Lithium Salt Reserve Base as 2MT for Argentina, 3MT for Chile, 5MT for Bolivia and 1MT for China – 11MT contained Lithium in total or about 58MT of potential Li2CO3. The US salt deposits are in decline. The relatively small hard rock mineral deposits can be discounted when considering their availability for batteries.
Note he gets to 58 million tonnes of lithium carbonate by multiplying his contained metal reserve base target of 11 billion tonnes by 5.323. Next, he reduces that number further by postulating that only a certain amount of lithium can be extracted in the recovery process. This reduces his total lithium carbonate reserve base further from 58 million tonnes to 33 million tonnes.
Finally, Tahil tries to estimate the total lithium carbonate requirement should we electrify the world’s entire fleet of cars:
The World Automobile Parc currently stands at about 900M vehicles. If they all used a 5kWh LiIon battery, they would contain 6.3M tonnes of Lithium Carbonate – and the fleet is growing all the time. 6.3M tonnes is in the region of at least 18% of economically viable Li2CO3 Reserves, including Bolivia. With a more realistic projection of at least an average 10kWh battery per vehicle, 36% of the world’s recoverable Lithium Carbonate Reserves would be consumed. 10KWh is still a small battery – even if 20kWh was achieved with the same Lithium utilisation, Lithium consumption will be at unsustainable levels.
So this is the core of his thesis. We have 35 million tonnes of economically viable lithium carbonate and 6.3 million tonnes is required to equip 900 million cars with 5 kilowatt hour (kWh) batteries; that is 18% of total reserve base of lithium. And with a 10 kWh battery that goes up to 36% and with a 20 kWh it goes up to 72%. And that is excluding all the other uses of lithium and the fact that the world’s population keeps growth, economies keep expanding and people keep buying more cars. So we run out of lithium.
Note that the kWh is the basic measure of energy storage for an EV. The energy stored in an internal combustion engine (ICE) vehicle is the number of gallons/litres of gasoline/petrol held in its tank.
Before we start poking Tahil’s thesis with a pointy stick, let’s just tease a very useful metric out of it. If we need 6.3 million tonnes of lithium carbonate to equip 900 million vehicles each with a 5 kWh battery, that means that we need 1.4 kg of lithium carbonate per kilowatt hour of battery cells.
Now let’s take his methodology and apply it to the present day situation. We currently have a fleet of 950 million cars and 350 million commercial vehicles (OICA here), the latter requiring even bigger batteries. To make range anxiety a thing of the past, many auto experts believe each passenger car will need a 75 kWh battery. And let’s give our trucks and vans a 200 kWh battery on average each. That adds up to roughly 141 billion kWh’s worth of batteries. Multiply that by 1.4 kg of lithium carbonate per kWh and it’s about 200 billion kgs of lithium carbonate or 200 million tonnes. “Houston we have a problem: Tahil says we only have 35 million tonnes of lithium carbonate!”
In his report, Tahil was not a shrill for the oil industry: he was still arguing for a big battery push away from fossil fuels, but just thought the auto industry was backing the wrong horse, and he proposed other chemical configurations as being much more sustainable. Nonetheless, his article had sufficient hooks to appeal to editorial desks across the world: ‘Bolivia as the New Saudi Arabia’ or ‘World Jumps Out of the Energy Frying Pan into the Fire’; the headlines wrote themselves.
The media’s love of Tahil’s take on lithium has one worrying aspect: Tahil had already demonstrated a certain lack of analytical objectively by writing a nut-job piece of analysis suggesting that the Twin Towers destroyed in the 911 terrorist attack in New York came down due to two controlled nuclear explosions. In short, Tahil is a bit of a loony conspiracy theorist.
Once Tahil’s views on lithium gained mainstream distribution, it was not long before Newton’s third law kicked into play: “For every action there is an equal and opposite reaction”. So as Tahil become the media ‘go to’ man on peak lithium, a retired geologist named Keith Evans came out of retirement to be tapped by the media as the ‘go to’ man for the counter argument; basically, Evans said Talil was talking a load of old rubbish. In a simple piece of symmetry Evans wrote a riposte to Tahil titled “An Abundance of Lithium“.
As background, Evans was a specialist in lithium and had worked on a US government National Research Council report back in 1976 whose remit was much wider than the USGS. Their aim was to see how much lithium would be available worldwide in an era of rapidly expanding demand due to not only battery storage demand but also for fusion energy. A key point in his report, and one I would agree with, is that a rising price begets supply.
Nonetheless, most of the report takes issue with Tahil from the perspective of a static analysis. In other words, Evans believed that Tahil had got his numbers wrong just by incorrectly knocking out a whole bunch of potential lithium carbonate sources from hard rock spodumene, pegmatites and certain brine deposits. After he had crunched his numbers, Evans came up with these figures for reserves and resources:
So now we have nearly 30 million tonnes of contained lithium metal compared with Tahil’s figure of 11 million. That translates into about 160 million tonnes of lithium carbonate, not enough to supply my back-of-the-envelope 200 million tonnes necessary to electrify the world’s car fleet (let alone the storage energy needs). In other words, while Evans analysis was far more optimistic than that of Tahil’s, it basically leads us to the same conclusion: not enough lithium.
But wait a minute, I trained as an economist and I don’t like such static approaches to analysis. Let’s go back to the USGS reserve and resources chart and remember that the right-hand column refers to “undiscovered resources”.
And how does the market decide to turn “undiscovered resources” into “identified” ones when you have a limited existing supply but a very large potential demand? Through price.
Has the price signal had any effect? You bet! Let’s jump to the latest Mineral Commodity Summaries report published by USGS in January 2018. On page 99, we get this table for lithium:
Reserves are now at 16 million tonnes and resources at 53 million tonnes. Back in 2005, those numbers were 4.1 million tonnes and 13 million tonnes, respectively. So in 10 years we have found a shed load of lithium. Moreover, 53 million tonnes of lithium translates into 282 million tonnes of lithium carbonate, the kind of quantity we need to support an EV transition.
Now at this stage I need to introduce some caveats:
Moving from contained metal in ore or brine to lithium carbonate results in losses
Not all resources will easily migrate to reserves.
Many of the resources are in geopolitically unstable areas of the world.
Battery grade lithium carbonate and lithium hydroxide require exceptional purity. Many sources of lithium contain contaminants or impurities that are difficult to remove.
Putting in mine infrastructure costs a lot of time and money. Ditto scaling up ore and brine processing capability.
Nonetheless, while I am not some kind of libertarian free market Ayn Rand acolyte, I think markets do a pretty good job of discovering scarce but needed resources through the mechanism of price (even if they don’t do a good job of dealing with externalities like climate change).
As an example, in Appendix C of the USGS Mineral Commodities Summary 2018 the case of copper is highlighted:
“Reserves data are dynamic. They may be reduced as ore is mined and (or) the feasibility of extraction diminishes, or more commonly, they may continue to increase as additional deposits (known or recently discovered) are developed, or currently exploited deposits are more thoroughly explored and (or) new technology or economic variables improve their economic feasibility. Reserves may be considered a working inventory of mining companies’ supplies of an economically extractable mineral commodity. As such, the magnitude of that inventory is necessarily limited by many considerations, including cost of drilling, taxes, price of the mineral commodity being mined, and the demand for it. Reserves will be developed to the point of business needs and geologic limitations of economic ore grade and tonnage.
For example, in 1970, identified and undiscovered world copper resources were estimated to contain 1.6 billion metric tons of copper, with reserves of about 280 million tons of copper. Since then, almost 520 million tons of copper have been produced worldwide, but world copper reserves in 2017 were estimated to be 790 million tons of copper, more than double those of 1970, despite the depletion by mining of more than the original estimated reserves.
Future supplies of minerals will come from reserves and other identified resources, currently undiscovered resources in deposits that will be discovered in the future, and material that will be recycled from current in-use stocks of minerals or from minerals in waste disposal sites. Undiscovered deposits of minerals constitute an important consideration in assessing future supplies.”
So we started with X amount of copper in 1970, since then we have consumed 2X amount of copper and now we are left with 3X amount of copper. That is the magic of the market dragging ‘undiscovered resources’ into the ‘identified’ category.
Now for this post, we did some wild back of the envelope forecasting of demand requirements for lithium based on Tahil’s assumption of 1.4kg of lithium carbonate being needed for 1 kWh of battery energy storage. Tahil’s numbers, however, look a bit dodgy and I think we could do better, so in my next post we will go full battery nerd and look at lithium content of different types of battery chemistry. In the process, we will start to build up a picture of how different battery chemistry leads to different performance and cost outcomes for different auto makers. Trust me, to make a call on whether Tony Seba will get 95% EV penetration and 130 million EV sales in 2030 you really need to know this stuff.
Not bad! I’ve reached number nine in my series of posts on Electric Vehicles (EVs) and haven’t done a post yet concentrating on Tesla. There are two main reasons for this. First, so much has been written about Tesla, and so many opinions are publicly available on the web about Tesla, that I am not sure I can add much.
Second, this is a series of blog posts looking at the question of whether EV penetration can realistically get to 95% in 2030, which roughly equates to around 130 million vehicles. Even if Tesla becomes the most successful auto company ever–or even if it becomes the most successful auto company ever multiplied by a factor of two–it alone cannot get even close to that target of 130 million EV sales. Let us say that in 2030 Tesla has the combined market share that Volkswagen and Toyota have today (the top two in terms of global autos sales market share). That combined VW-Toyota percentage share of the market now would equate to Tesla selling about 30 million cars in 2030. Pretty bloody good (if it ever happens), but it will not get us even close to 130 million EVs. For that to happen we need the collective heft of the rest of the global auto players.
Nonetheless, in our S-curve analysis we started by looking out 5 years, since battery plant and auto lines need to be financed and designed now in order for cars to roll off out in sufficient quantity in 2023. So let’s recycle this chart again:
In my post on China’s New Energy Vehicle (NEV) strategy, I surmised that it would be relatively easy for China to hit its target of having 5 million NEVs (made up almost entirely of EVs rather than fuel-cell vehicles) on the road by 2020. That would see Chinese consumers buying around two million EV vehicles that year. My next question is whether Tesla, as the current world’s largest seller of EVs, could supply a large chunk of the other 3.6 million EVs needed in 2020 to stay on Tony Seba’s S curve. My answer to that is “possibly”. Here’s how.
First, Tesla will have enough batteries. From the press release accompanying their January 2017 investor event relating to their factory in Nevada:
“Gigafactory 1 (GF1): GF1 is the world’s leading battery production facility, maintaining high efficiency and output while achieving the lowest capital investment per gigawatt hour (GWh) and the lowest production cost per kilowatt hour (kWh).
The factory will produce cells, battery packs, energy storage products and vehicle components. Phase 2 construction, currently underway, will support annualized cell production capacity of 35 GWh and battery pack production of 50 GWh. The cell capacity represents more than the 2013 total global production of lithium-ion battery cells of all other manufacturers combined and supports the production of about 500,000 cars.”
So in January 2017, battery plant capacity was already being put in place to fit out 500,000 EVs. By 2020, that number will be a lot higher.
Tesla delivered 101,312 Model S and Model X vehicles in 2017, and Elon Musk has stated his intention to produce 10,000 of the mid-market Model 3 a week by the end of 2018. The press has been rife with stories over how Tesla has been missing its production targets in 2018 for the Model 3, but in April Elon Musk tweeted that production was now exceeding 2,000 per week, which is on top of another 2,000 Model S and Model X vehicles. He then went on to say that they should be producing 5,000 a week of the Model 3 by end June with a stretch goal of 6,000. If we take the 5,000 number add 2,000 Model S plus Model X’s and multiply by 50 we get 350,000 EV sales annualised.
So far, this entire series of blog posts have been dedicated to the supply side; in short, the question of whether the auto manufacturers have put, or will put, enough plant in place to physically build the necessary number of EVs for us to move up Tony Seba’s S curve of EV market penetration versus internal combustion engine (ICE) vehicles. I have said nothing about whether consumers will want to buy a ton of EV cars. In Tesla’s case, however, the demand side is already in the bag for a couple of years since the company has 450,000 reservation deposits for the Model 3 as reported in Tesla’s Q1 2018 results update letter released on 2 May 2018. This really is a case of “build it and they will come”. Moreover, for those who don’t believe that EVs can go mass market look at this chart contained in the same release by Tesla:
Given Tesla will be on an annualised run rate of 350,000 cars by end of June, it looks entirely feasible that this figure will improve to 500,000 by year-end. Then, with the gigafactory in Nevada being scaled up again and more new models to be released over the next two years, it looks likely that Tesla alone could do a third of the 3.6 million vehicle sales needed outside of China to stay on Tony Seba’s S curve through to 2020.
The situation beyond 2020 will be the subject of a separate post, but I want to finish this post by introducing a video by Jack Rickard, an electric car expert, explaining why he thinks Tesla will continue to go from strength to strength. Rickard looks like a Hollywood caricature of an elderly battery nerd, and I will come back to one of his videos where he deconstructs a Tesla battery in a future post.
What I like about Rickard, however, is that he obviously never picked up the book “How to Give a Ted Talk” or, for that matter, any self-help book on presentation style or image branding at an airport book stand. From looking at some of his videos, I have drawn up a Jack Rickard guide to giving a presentation:
Never go to the gym in an attempt to stay in shape: life is too short for such a colossal waste of time.
Dress like you don’t give a shit, because you don’t give a shit.
On the day of your presentation, don’t change your grooming routine since you don’t have one.
When deciding on the length of your presentation, first think of the likely average attention span of your audience. Second, quadruple that number and add a bit more.
Go off at random tangents at great length.
Don’t talk to the camera. Look down a lot and mumble.
Write down your presentation on multiple pieces of paper, then laboriously talk to each page.
Fancy infographics and the like are for morons.
You know your IQ is a lot higher than the vast majority of your audience: communicate that fact to them. Don’t patronise them by letting them think they are cleverer than they really are.
Realise that you can get away with one through nine only because you really, really know your subject.
So here is Jack Rickard spending one hour 50 minutes explaining why Tesla is revolutionising the auto industry, why its competitors are unable to respond and why Tesla’s stock is a screaming “buy”. Enjoy:
When following the EV story in the Western press, you would be forgiven for thinking that it is solely a story about Tesla. Having such a flamboyant and charismatic head in Elon Musk obviously helps the narrative. Another reason for the neglect of the Chinese EV market is that it is just bloody difficult to discern what is going on there.
The ownership structure of Chinese automakers is complicated, with public-private partnerships, joint ventures with foreign makers, and cross- and subsidiary-holdings galore. Moreover, new entrants into the EV market are announced almost every day, fresh alliances are formed, units are spun out or merged and foreign parters are brought in or dropped.
The fragmented and somewhat chaotic nature of the Chinese auto-manufacturing marketplace was viewed as a disadvantage in the Harvard-Kennedy study I referred to in a previous post. Yet out of this chaos has grown increasing Chinese market share: 10 of the top 25 best-selling EV models globally in Q1 of 2018 were Chinese brands (Chart from EVvolumes.com).
The situation contrasts markedly with what is going on in the overall Chinese market where ICE vehicles still dominate. There, Volkswagen sits supreme at the top, with only 1 Chinese maker in the top five. I’ve marked in red those Chinese producers who have EV models featuring in the table above (note Zhi Dou is a subsidiary of Geely).
Moreover, there appears to be a distinct difference in strategy between foreign and Chinese makers with respect to EVs. The few foreign firms that have invested heavily in EVs (Tesla excepted) have just promoted one or two EV models to champion in this space: think GM’s Chevrolet Volt and Bolt, Nissan’s Leaf, BMW’s i3 and Mitsubishi’s Outlander (although as I posted on here, over the last six months that has changed radically).
Many Chinese makers, by contrast, have been setting up or spinning out dedicated EV subsidies whose aim is to launch a range of models and who are less worried about cannibalising successful and profitable existing ICE lines. The Chinese makers also have the advantage of access to risk capital through multiple public-private channels under China’s unique form of Wild West capitalism. So the Chinese majors a) have large equity stakes from state-owned enterprises, b) are able to borrow from state-owned banks, and c) are also accessing global capital markets through listing on stock exchanges in China and Hong Kong.
Let’s dig a little deeper into those Chinese names who have had initial success in the Chinese EV marketplace, and some of the larger auto makers who are yet to show up in the EV rankings. We should note, however, that at this early stage of the S curve, rankings are very fluid and names can suddenly appear at the top of the sales charts from out of nowhere, or, for that matter, drop off.
Geely
In the US, most observers would nominate Elon Musk of Tesla, Jeff Bezos of Amazon, Mark Zuckerberg of Facebook and Larry Page and Sergey Brin of Google as visionary leaders. Jack Ma of Alibaba has also made it into the Western consciousness but not so Li Shufu of Geely. A hybrid oligarch entrepreneur, Li has personally bought a 9% stake in Daimler and a 6% stake in Volvo Trucks. That comes after Geely (Li is chairman) bought Volvo cars outright in 2010. More recently, Geely took a controlling stake in supercar maker Lotus in January 2018.
With the announcement that Volvo will only sell EVs or hybrids from 2019, Geely has a dedicated EV brand at the top of the market and also one at the bottom of the market with Zhi Dou. It is also rapidly electrifying its mid-market offerings that it sells in its own name, with a major announcement of a new plug-in version of its flagship Bao Rui Sedan at the Beijing Motor Show in April 2018. The company’s intention is clear: it wants to extend the Volvo EV commitment across all its offerings at breakneck speed as spelled out by its CEO and President An Conghui:
“China will ultimately become the global centre of a new energy revolution that will reinvent the car as we know it, hence making its automotive industry stronger and more resilient. As a leading Chinese automotive brand, we’ve realised that competition in this new era will come in the form of a technology war and that we must lead through technological innovation to become the vanguard of this new age.”
Changan Motors
While none of Changan Motors models are present in the top 25 table above, the company already is marketing a range of EVs in the SUV, mid-market sedan and compact car segments of the market.
The company also launched its “Shangri-La Plan” in September 2017, which includes a $15 billion investment in EVs, and 33 EV models to be added to its existing line-up of 4 EV models,by 2025; at that time, all its models will be offered as EVs. An interesting part of the plan was the announcement of strategic partnerships with the German parts maker Bosch, the dominant Chinese search engine Baidu, the ride-hailing company Didi Chuxing and the lithium-ion battery producer CALT (the largest lithium-ion battery maker in the world).
Again, I am not sure how many observers of the EV market realise the type of technology and capital Changan is accessing through these alliances. Didi is the largest ride-sharing company in the world, far outpacing Uber and Lift. It has a market capitalisation of $50 billion, larger than Tesla. Baidu is the largest search engine the world after Google and one of the leading companies in artificial intelligence (AI). Its market cap at $75 billion is larger then any car maker in the world except for Toyota and Volkswagen.
Not surprisingly, Changan Motors wants to lever these relationships with Didi and Baidu so as to become a leader in autonomous driving technology.
SAIC (Shanghai Automotive Industry Corporation ) Motor
As is typical in the Chinese auto industry, the state-owned (and thus deep-pocketed) SAIC pops up in my top 50 sales ranking of the Chinese auto market in a number of different places. In seventh place is its Baojun marque, which is a joint venture between SAIC and General Motors at the budget end of the market competing against Geely and Chery. It does have EV aspirations and a dedicated EV plant was established in 2017.
For more high-end vehicles, however, we need to turn to SAIC Roewe, SAIC’s luxury marque. In my last post, I quoted Ken Brinsden of Australian lithium-mining company Pilbara Minerals. Ken said this at a presentation to the Melbourne Mining Club:
“For those of you who have a picture in your mind that the Chinese cannot build a quality outcome, I’m telling you they are already there.”
If you don’t believe him then check out SAIC Roewe’s EV SUV the eRX5 and their i6 saloon, which feature in the Chinese sales table above at ranks 16 and 18. Even more impressive is that SAIC have teamed up with Jack Ma of Alibaba to incorporate every aspect of digital technology into future car production (quote from here):
“In July 2016, Alibaba Group and SAIC (Shanghai Automotive Industry Corporation), one of the largest auto manufacturers in China, teamed up to launch the Roewe RX5, a brand new SUV that incorporated Alibaba’s ALIOS operating system and that was dubbed “The world’s first mass-produced internet car.” Just one year later, in July 2017, the Roewe RX5 was already the 6th best-selling SUV in its category in China.
And, most importantly, when asked about their buying decision 75% of customers said they purchased the RX5 because of its connectivity. In other words, what they valued most of all was not the car’s design or its comfort, its engine performance, or its safety standards, but the fact that it gave them the connected mobility that would integrate them seamlessly with the rest of Alibaba’s ecosystem, where smartphones, shopping sites, payment systems, video services, IOT-enabled home appliances, wearable devices, and – yes – cars, are all linked together as part of one comprehensive digital immersion experience.”
Dongfeng Motor Corporation
Another state-owned enterprise like SAIC, Dongfeng has been somewhat of a laggard in the EV space. Currently, it main avenue to incorporating more EVs into its line-up is through its joint venture with Nissan, the Dongfeng-Renault Automotive Company (DRAC). Yet don’t count Dongfeng out due to its access to huge amounts of capital.
FAW Group
The FAW Group is another state-owned enterprise; along with Changan Motors, SAIC and Dongfeng, FAW is part of what are called the ‘Big Four’ in Chinese automotive circles. In FAW’s case, its joint venture with Volkswagen Group has made it one of the largest players in the Chinese automotive market.
In December 2017, recognising that the Chinese automotive market was entering a new era centred around EVs, FAW entered an agreement with two other of the Big 4 state-supported enterprise Changan and Dongfeng to pool resources. The agreement had the following goals:
Establishment of a national innovation centre for intelligent connected vehicles.
Creation of an advanced technology innovation centre that will develop in the fields of new energy, internet connectivity and lightweight materials.
Joint investment and development of core technologies and shared platforms.
I would expect a number of well-financed new EV initiatives to come out of this alliance.
Great Wall Motor Company
In number eight in the overall (ICE plus EV) sales chart is Haval, which is a marque of Great Wall Motor Company specialising in SUVs. In my last post, I mentioned that Great Wall has also set up an EV specialist operation under the Wey marque.
A hiring spree for top European auto talent resulted in Jens Streingrabber, who was responsible for SUV development at Audi, coming to the group as CEO for the Wey brand. He was later joined by the chief designer from BMW. Great Wall’s aspirations are evidenced by initiatives to incorporate Level 5 autonomous driving capability and contactless charging in future Wey models.
Beijing Automotive Holdings (BAIC)
BAIC is 60% owned by the Chinese government and 12% by Daimler of Germany. In January, 2018, Beijing Electric Vehicle Company (BJEV) was spun out of BAIC as a pure play EV company and currently boasts the top-selling EV in China, the BJEV EC180/200.
In March 2018, BAIC opened a brand new dedicated EV factory in Changzhou, Jiangsu province, which at full production will be capable of making 300,000 vehicles per year. BAIC has promised to end the sale of all fossil fuel cars by 2025.
The parent company BAIC, together with other state-entities, own a majority share of BAIC Motors, which is an auto company listed in Hong Kong (the listed piece of BAIC whose market cap I have included in the chart above; but don’t confuse it with the valuation of the wider group). The principal business of BAIC Motors are joint venture operations with Daimler (Beijing Benz brand) and Hyundai (Beijing Hyundai brand), as well as its own-brand vehicles (Beijing Brand).
BYD (Build Your Dreams)
Considered the closest Chinese equivalent to Tesla, BYD is a pure EV player, built out of a battery business rather than an ICE business. Its model the Song ranked fourth by sales in China in the first quarter of 2018. Warren Buffet and Charlie Munger’s investment in BYD way back in 2009, so the company has had some publicity overseas. Listen to Charlie Munger talk about BYD’s CEO Wang Chuanfu:
BYD remains just as much an electronics company as an automotive company as can be see from its latest annual report:
Wang Chuanfu, visionary CEO, started the company as a specialist in lithium-ion batteries for cell phones and has expanded from there. A major difference between BYD and Tesla, however, is that BYD’s core competence has been in lithium-iron phosphate battery chemistry. Such battery cells are very stable but lack the specific energy (energy stored per unit of volume) of batteries (like Tesla’s) that make use of cobalt compounds. This is an important topic, but I will return to it as a post in its own right down the road.
The company also has a strategic alliance with Daimler, and in September 2017 Daimler announced a large expansion of both battery production and EV sales in China working with BYD.
JAC (Anhui Jianghuai Automobile) Motors
Another state-owned company though with a stock market listing. JAC also has an alliance with Volkswagen (along with FAW and SAIC) and in 2017 they announced a joint project to build 100,000 pure EVs per year. The JV will see $12 billion invested over the next 7 years through to 2025, with the aim of producing 40 EV models locally.
To date, its EV offerings in China, such as the iEV6e have been at the compact end of the spectrum like those of Geely and Chery.
Chery Motors
Chery is an independent non-state company like Geely. It is the only Chinese company that, to date, has had some success marketing its products abroad, with over one million units exported.
Simultaneous with the Frankfurt motor show, Chery announced its intention to start selling all-electric models in Europe in 2017. While the Chery eQ EV is a SMART-type city compact car, the new offerings being promoted and unveiled at recent motor shows are are at higher sticker price tags including the compact SUV Exeed TX. They incorporate high-end electronic systems similar to Tesla, such as a 10-inch touch screen.
Jiangling Motors (JMC)
In the past, JMC was mostly associated with a joint venture with Isuzu of Japan, selling compact cars. More recently, however, it has been expanding its EV offerings in larger model sizes. In addition, Ford has been negotiating with JMC to set up an EV operation in China aimed at producing commercial vehicles. This is in addition to Ford’s EV joint venture with another Chinese auto maker Anhui Zotye.
I could go on with this blog post since I have yet to cover the EV aspirations of a whole host of other Chinese EV makers, both incumbents and brand new entrants. The above, however, gives you a sense of the fever pitch activity going on in the Chinese market. Out of this rather complex mess of car-maker acronyms and complicated holding structures, I will, nonetheless, pull out some key points:
The Chinese market hosts a vibrant ecosystem of disruptors who wish to leapfrog western dominance of auto markets through jumping directly into high spec advanced EVs. These include BYD, Changan Motors, SAIC Roewe, BJEVs and Wey.
Like the US, China has access to leading edge digital technologies like AI through its huge tech firms such as Baidu and Alibaba. These deep-pocketed tech firms are forming alliances across the board with auto makers and in the process changing cars into consumer electronics items as much as a means of transport.
You shouldn’t count out the large laggards like FAW and Dongfeng. They have what a company like Chrysler doesn’t: massive state support. The support consists of a) vast pools of capital composed of both state-originated equity and loans and b) the means to transfer in technology through the state’s control of overseas makers access to the Chinese market (in effect limiting access to joint ventures only).
Lastly, take a looks at this video (which has a rather annoying computer-generated interpreting system from Chinese into English, but bear with it) You will get to see BYD’s 4 wheel drive EV the SEED, with a 600km range on one charge and an acceleration of zero to 100 km in 3.9 seconds. Tesla: eat your heart out.