This month, I will take a quick look at both the natural gas (including shale) price and production forecasts of the U.S. government’s Energy Information Administration (EIA) going out to 2015 and beyond to 2040.
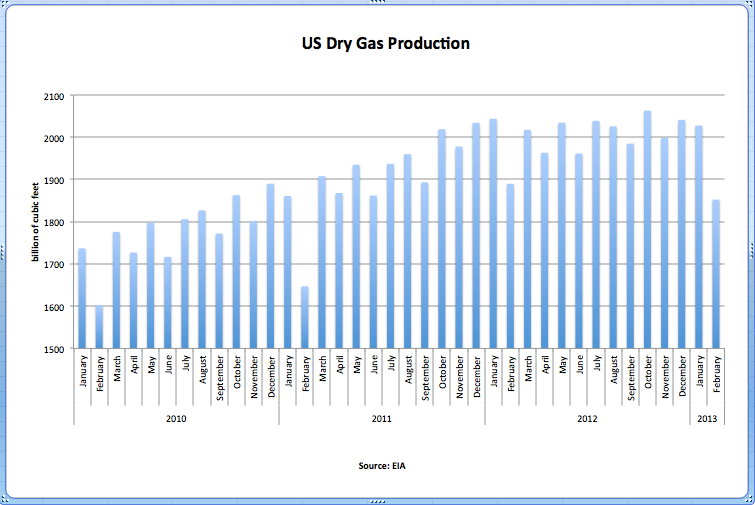
But first, here is the latest monthly data release made on October 31, which covers the period up until end August 2013. Data is reported in billion cubic feet (bcf) wit a two-month lag. Key points:
- August 2013 natural gas dry production: 2,080 bcf, plus 2.7% year-on-year
- Average monthly production for the 12 months to August 2013: 2,018 bcf, +1.3% over the same period the previous year
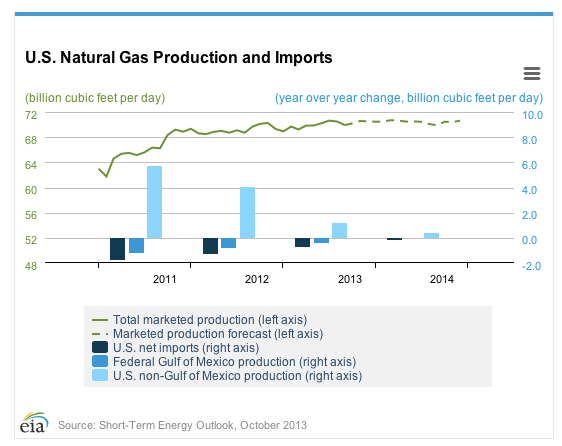
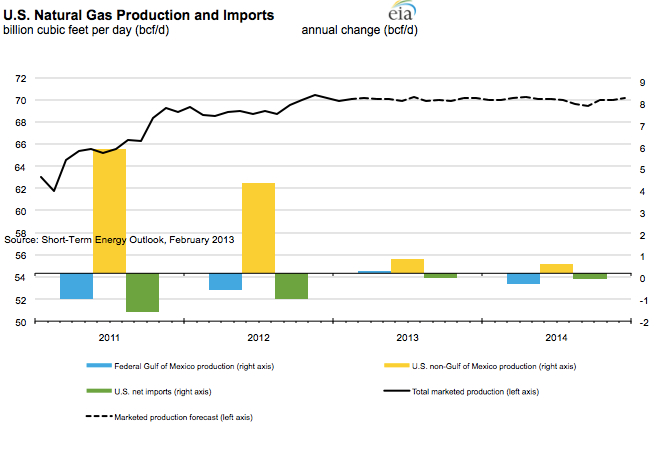
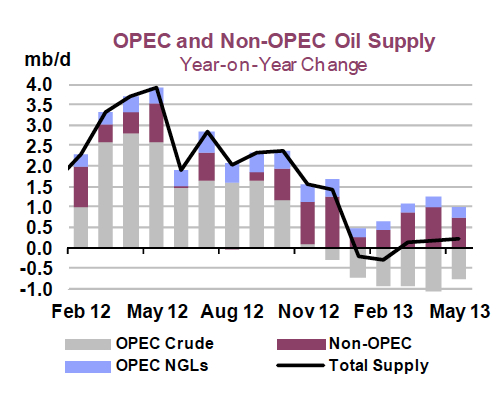
Since the end of 2011, the rate of production increase has rapidly decreased (click chart below for larger image).

What is more, the EIA, in it’s latest Short Term Energy Outlook publication issued in October, sees no major change in production out to the end of 2014:

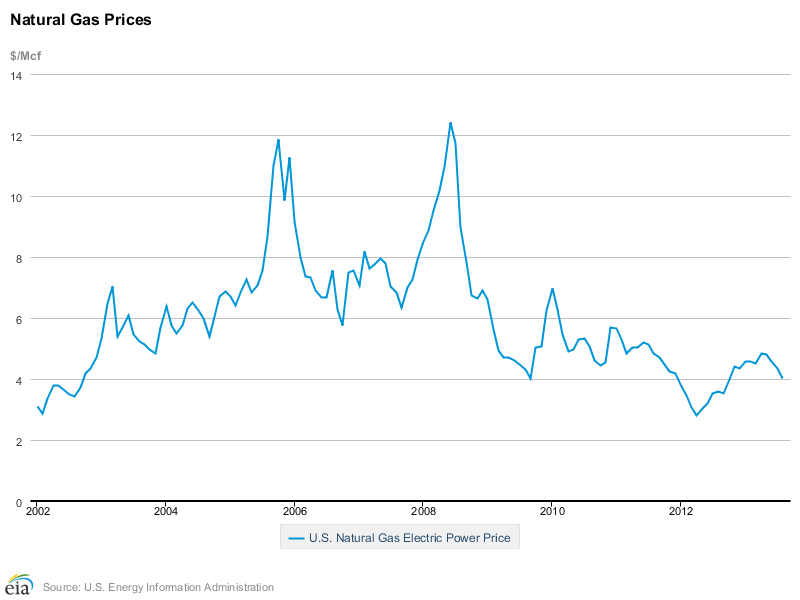
The continuation of the status quo into the near future also applies to price, with respect to which the EIA sees only a marginal upward drift through 2014.

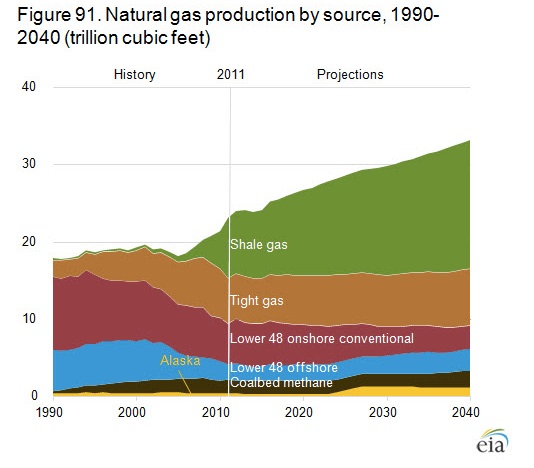
Going out far longer into the future, the EIA is a lot more optimistic over production growth. The EIA’s Annual Energy Outlook publication released in April 2013 sees the current hiatus in production growth ending mid-decade and steady growth thereafter. As a result, the US moves from being a net importer of natural gas to being a net exporter.

A couple of critical caveats are in order here. First, of the 3.6 trillion cubic feet of natural gas exports forecast for 2040, the majority is predicted to be piped across the border to Mexico. LNG exports, meanwhile, are expected to commence in 2016 and grow to 1.6 trillion cubic feet by 2040.
To put this in perspective, UK LNG imports alone totalled 1 trillion cubic feet in the first six months of 2013 (see here). True, the fact that the US ceases to import natural gas frees up overseas supplies to be redirected elsewhere, but while the net change of around 5 trillion cubic feet from import to export is material, it is not a “game changer”.
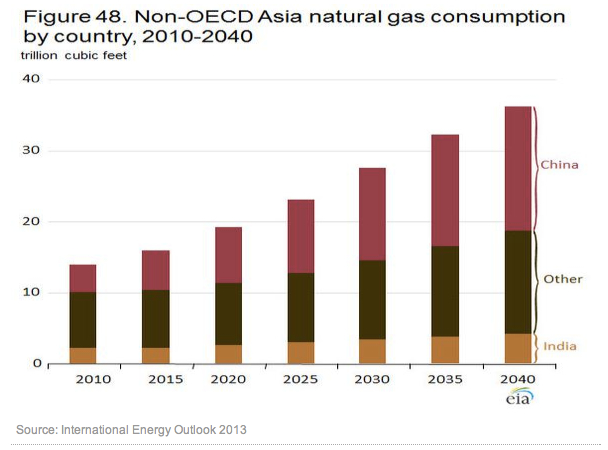
To illustrate this, the EIA sees China’s natural gas consumption expanding from 3.8 trillion cubic feet in 2010 to 17.5 trillion cubic feet in 2040, a large chunk of which will come from imports.

In addition, for the US production growth to materialise, the EIA realises that price has to rise. In short, the US natural gas story is one of cheap-to-produce conventional gas being replaced by expensive-to-produce shale gas.

And that can only happen if the price of gas goes up, which is what the EIA expects to happen.

This merry and complicated dance between price and production is what led to Peter Voser, outgoing CEO of Shell, admitting to The Financial Times that the company’s investment in unconventional oil and gas production had not turned out as planned (see here). However, in order for the EIA’s forecast of a return to production growth around 2015 to come true, investments have to be made. And such investments will only be made if they are predicted to be profitable. That means either one of two things must happen: technology must bring costs down considerably or prices must go up.
As regards technology, we are in rather a ‘Red Queen’ situation in that we must run ever faster just to stand still. The reserves remaining to be exploited grow ever more complex and remote by the day. So we need technological improvements to compensate for the rising inherent costs in the difficult reserves we are next to exploit – let alone bring incremental increases in production.
Meanwhile, price rises require a robust economy. If GDP is expanding, a country can afford to apportion more expenditure to energy. If GDP growth is anaemic, it can’t. (I am putting to one side all the implications for climate change here.)
Of course, the EIA must, by its nature, sound a somewhat optimistic note with respect to the future. Further, it is true that unconventional oil and gas production jumps did stop the Great Recession morphing into a Great Depression Two. Nonetheless, the jury is still very much out over whether shale will disappoint.
The pessimistic scenario is one where we do get energy price rises as the EIA predicts but without production growth. This combination would put the global economy back into recession by decade end. Let’s see which story the incoming numbers support.